Content Insights
Overview
Content Insights reports enable you to compare profiled audiences across multiple content insight category modules.
Each module is represented by a distinct report that enables you to view the affinity of the profiled selected users and baseline users.
By default, the baseline is a set of all known users. The baseline can be configured by selecting the Baseline tab on the left pane.
The Content category displays audience data in the following modules:
- Top Yahoo Sites: Video & Non-Video
- Devices: Video & Non-Video
- Top Yahoo Sites by Devices
- Top External Site Visits
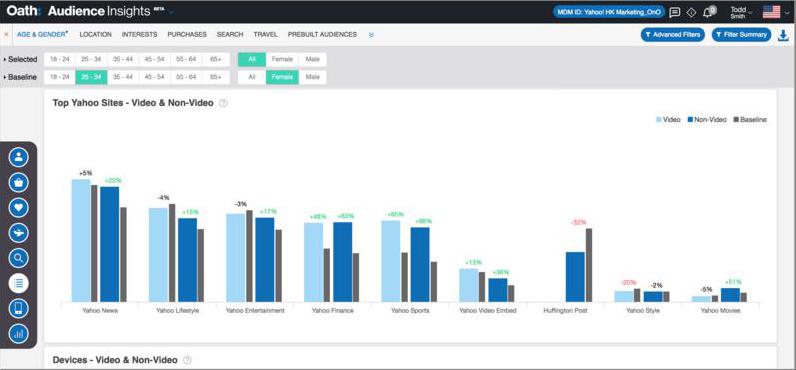
Top Yahoo Sites: Video & Non-Video
The Top Yahoo Sites - Video & Non-Video report displays the distribution of profiled selected users and baseline users by Yahoo sites visited for video and non-video content.
Using controls in the console, you can configure the Top Yahoo Sites: Video & Non-Video report to highlight different aspects of the data:
- The report may be displayed as a vertical bar chart, horizontal bar chart, or stacked bar chart.
- Data may be sorted by affinity, by percentage of selected users, or by percentage of baseline users.
Top Yahoo Sites: Video & Non-Video report data is based on previous 30 days of Devices: Video & Non-Video module data. To learn more, see Top Yahoo Sites: Video and Non-Video module data sources.
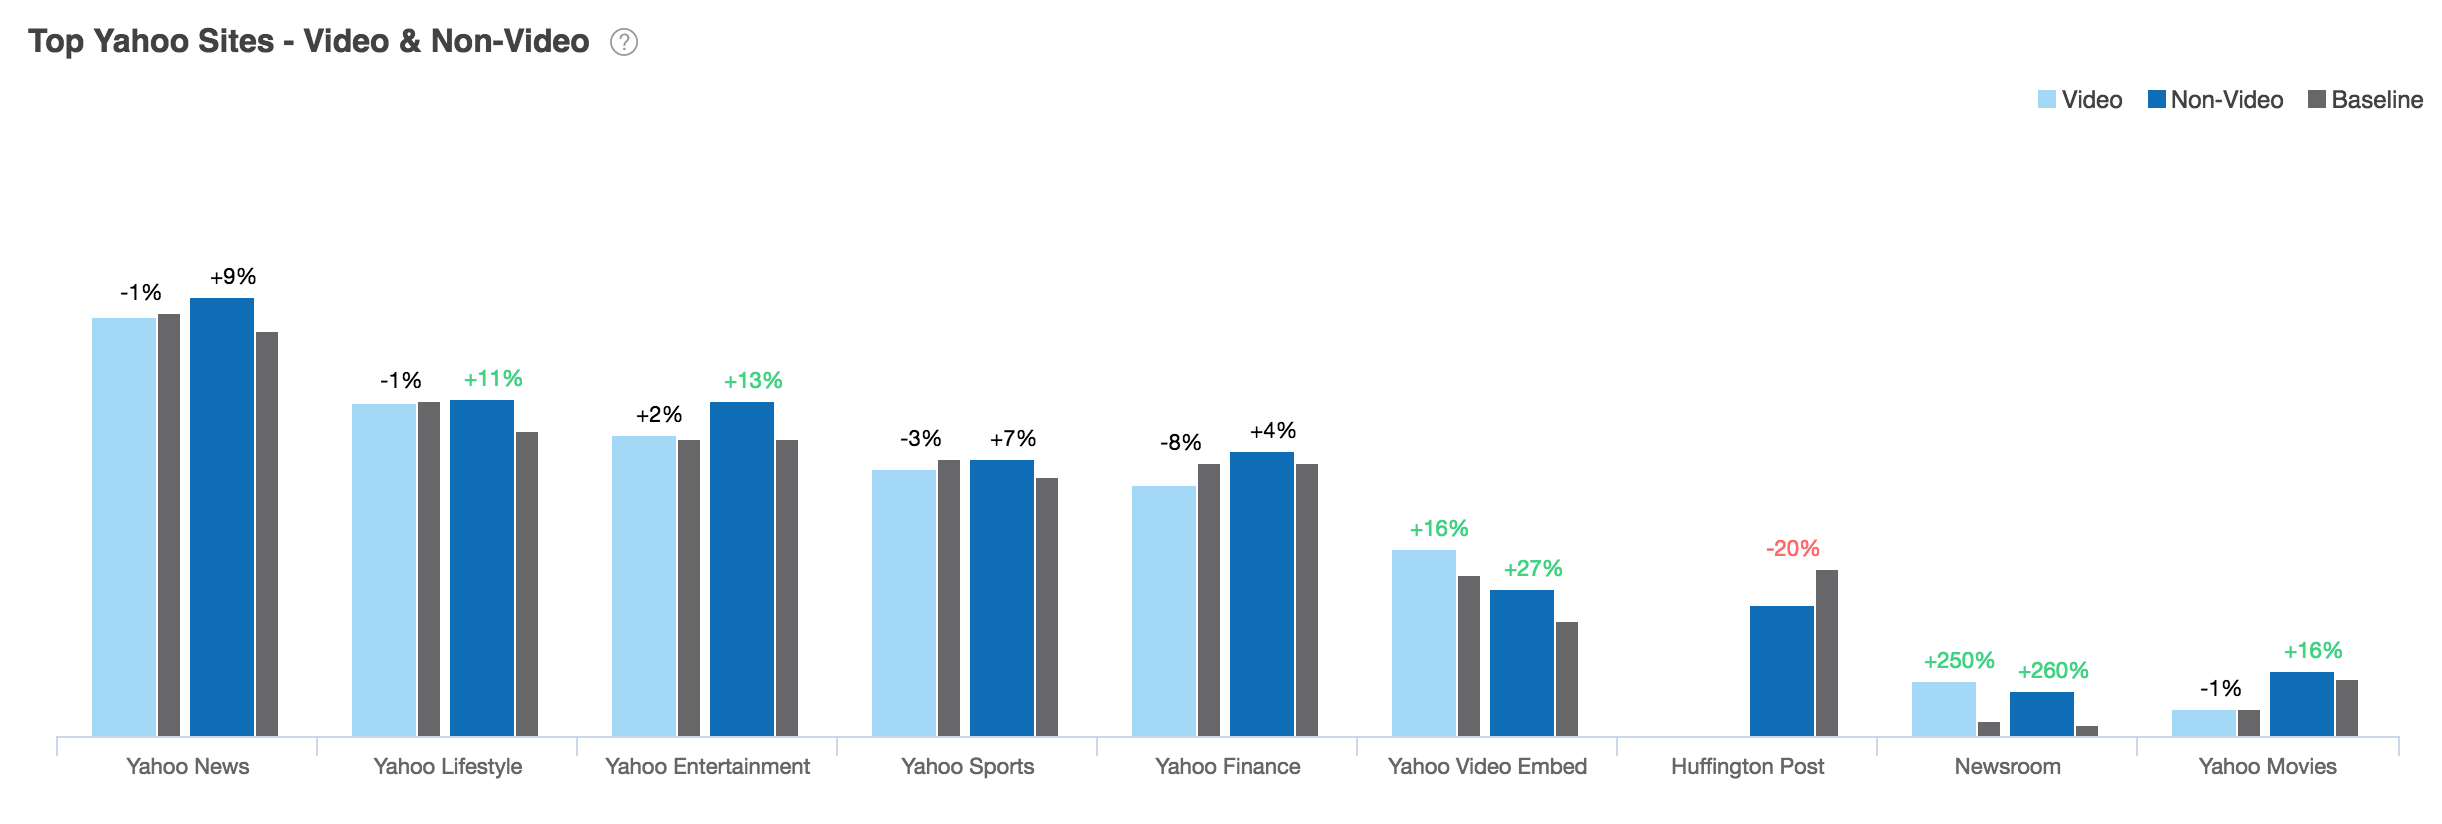
Devices: Video & Non-Video
The Devices: Video & Non-Video report displays the distribution of video and non-video viewed by audiences by device type.
Using controls in the console, you can configure the Devices: Video & Non-Video report to highlight different aspects of the data:
- The report may be displayed as a vertical bar chart, horizontal bar chart, or stacked bar chart.
- Data may be sorted by affinity, by percentage of selected users, or by percentage of baseline users.
Devices: Video & Non-Video report data is based on previous 30 days of Devices: Video & Non-Video module data. To learn more, see Devices: Video & Non-Video module data sources.
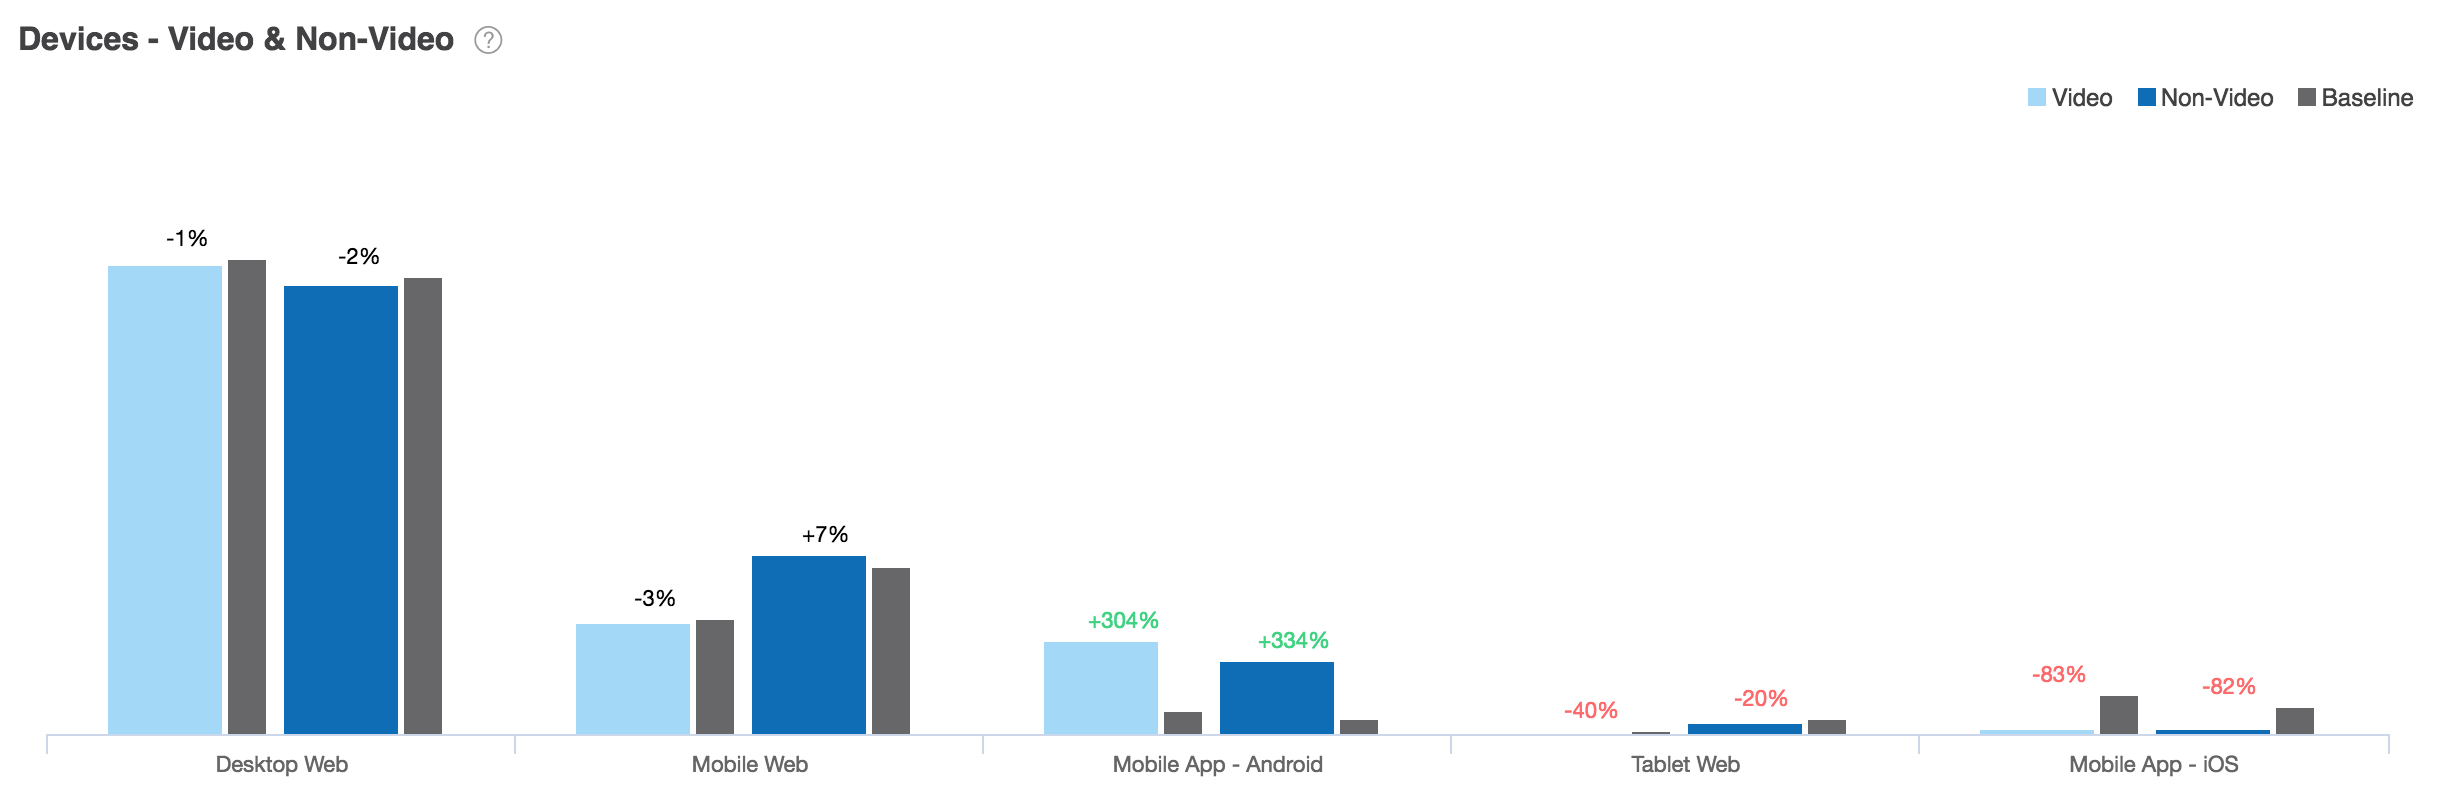
Top Yahoo Sites v Devices
The Top Yahoo Sites v Devices report displays the distribution of profiled selected users and baseline users by sites and devices.
The report consists of two charts: a table that highlights Yahoo sites by device and a treemap chart the shows the relative size of Yahoo site-device pairings.
The table chart shows distribution of profiled audiences across Yahoo site and device pairings by percentage.
Fig. 91 Top Yahoo Sites v Devices Table Chart
The treemap chart displays rectangles to show relative proportion of the distribution of profiled audiences across Yahoo site and device pairings in relative size.
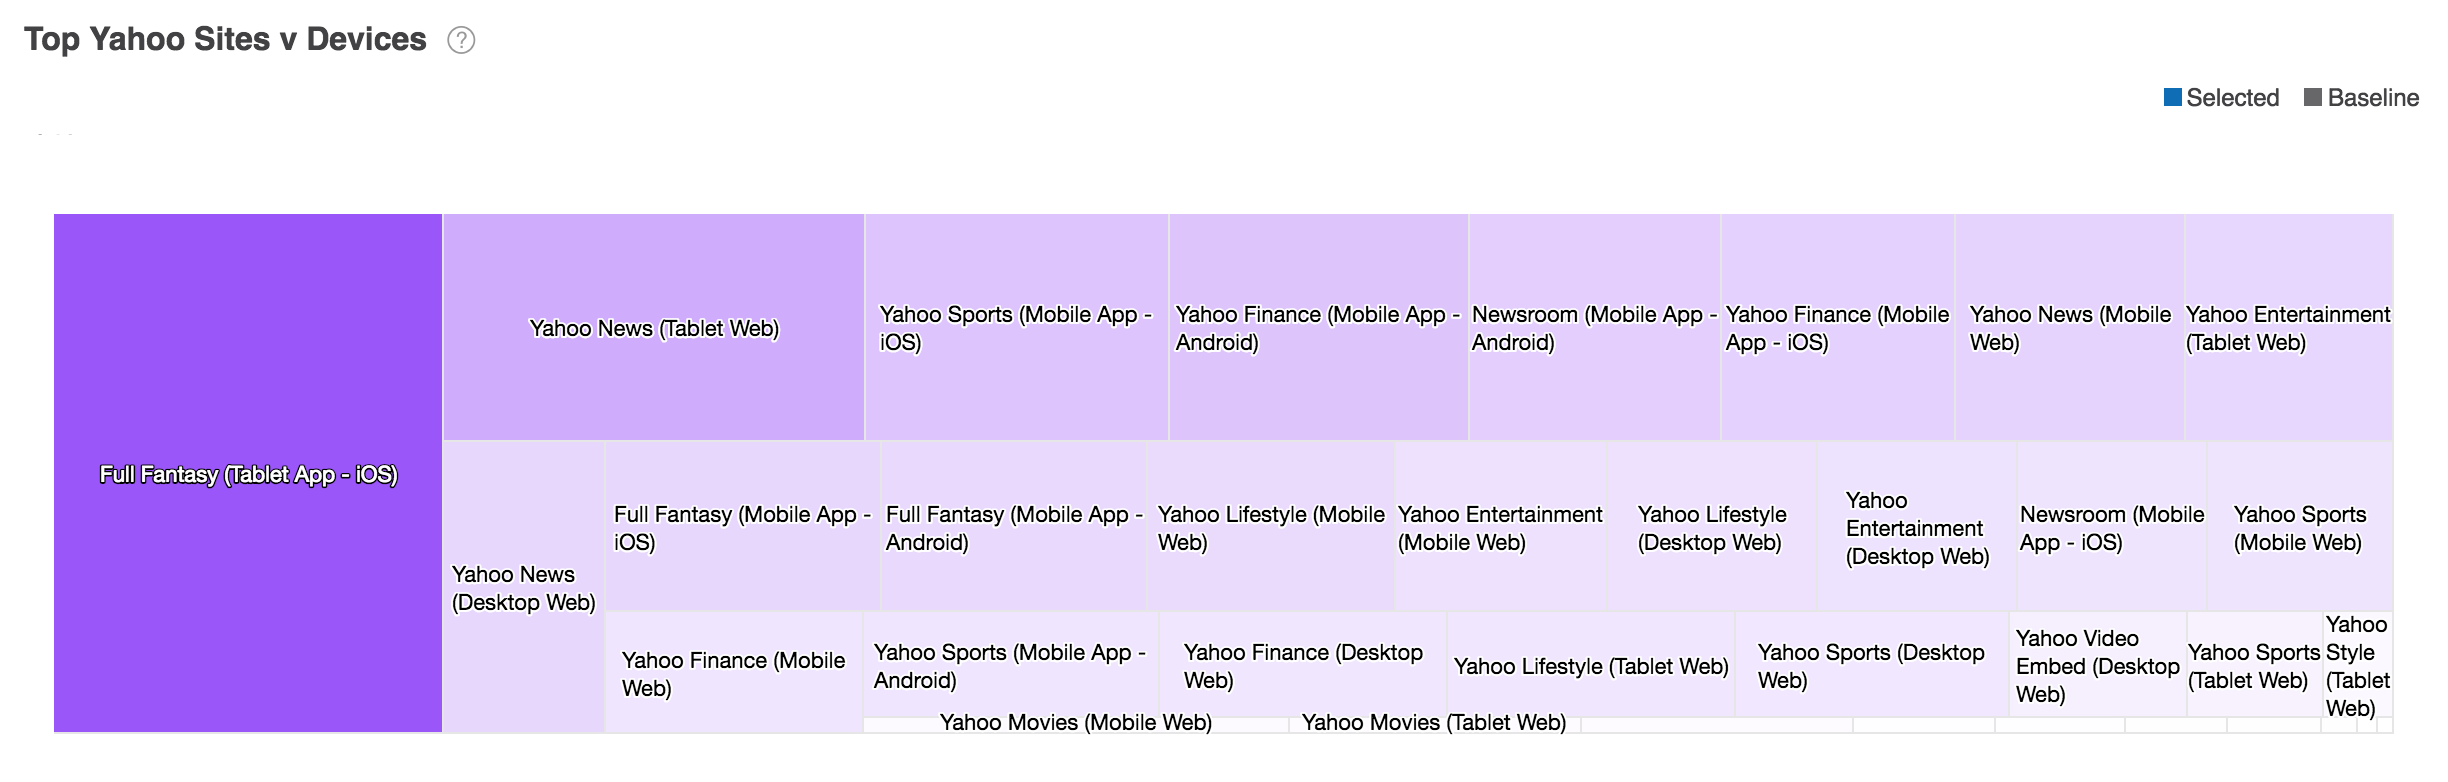
Fig. 92 Top Yahoo Sites by Devices Treemap Chart
Using controls in the console, you can configure the App Install Category report to highlight different aspects of the data:
- The report may be displayed as a table chart or treemap chart.
- Data may be sorted by affinity, by percentage of selected users, or by percentage of baseline users.
Top Yahoo Sites: Video & Non-Video report data is based on previous 30 days of Top Yahoo Sites module data. To learn more, see Top Yahoo Sites v Devices module data sources.
Top External Site Visits
The Top External Sites Visits report displays the distribution of profiled selected users and baseline users by external sites visited. The Top External Sites are independent of a users content consumption on Yahoo.
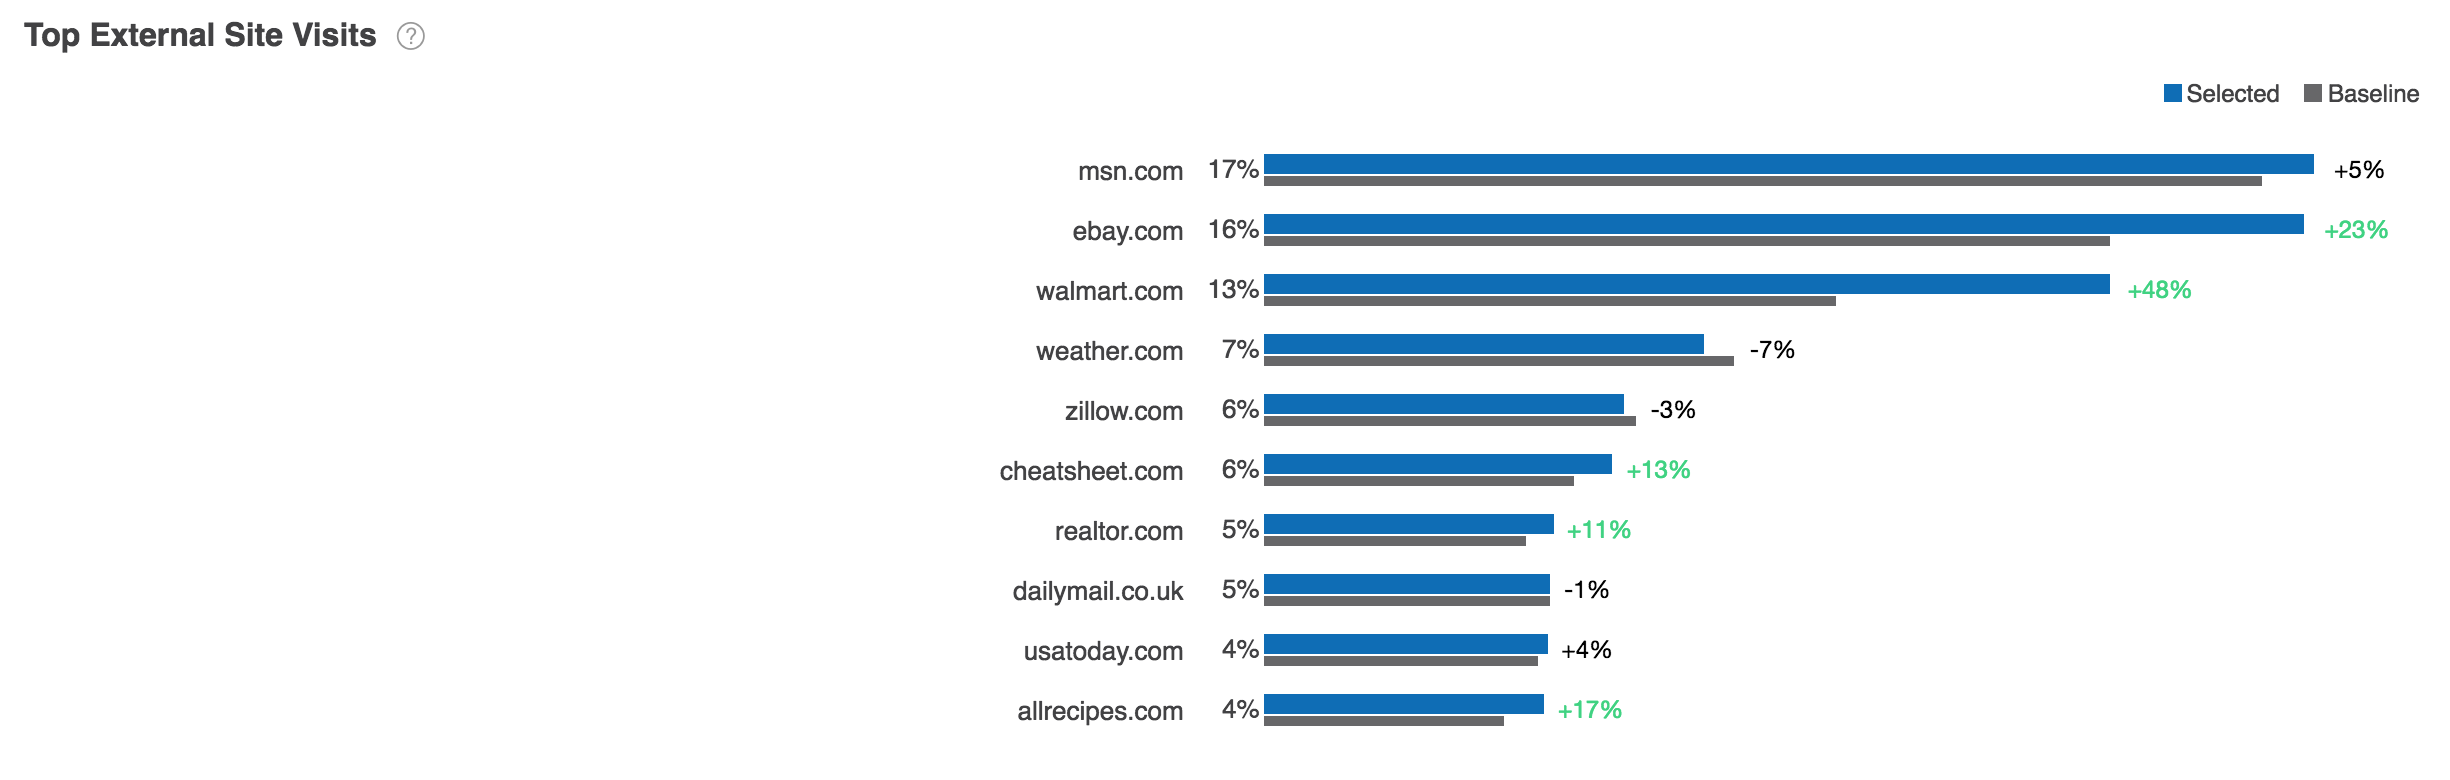
Fig. 93 Top External Site Visits Report
Using controls in the console, you can configure the Top External Site Visits report to highlight different aspects of the data:
- The report may be displayed as a horizontal bar chart or vertical bar chart.
- Data may be sorted by affinity, by percentage of selected users, or by percentage of baseline users.
- By default, the report shows the distribution of audiences across the top ten external sites visited. Use the Count dropdown list to choose the number of external sites displayed.
Note
Third-party site visits are proxy based. Audience Insights reports data based on the ad calls we get at the DSP level. We can only see the calls that we win. It is sample based, but still an accurate reflection of their site visitations.
Top External Site Visits report data is based on previous 30 days of Top External Site Visits module data. To learn more, see Top External Site Visits module data sources.