Demographic Insights
Overview
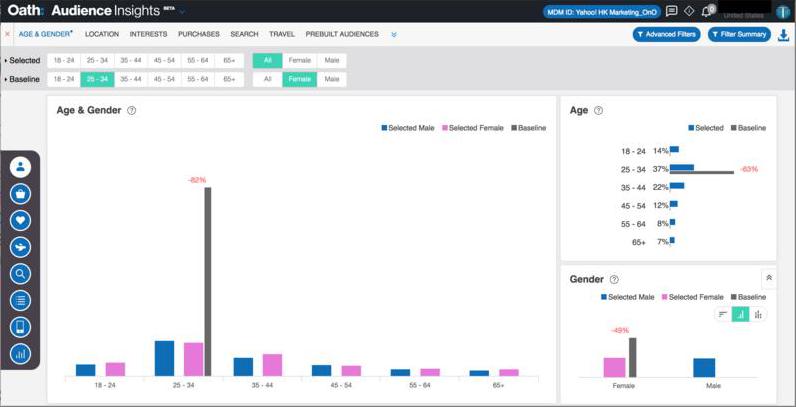
Demographics reports enable you to compare profiled audiences across multiple demographic category modules. Each module is represented by a distinct report that enables you to view the affinity of the profiled selected users and baseline users.
The Audience Insights console displays the following demographic reports:
|
|
|
Age & Gender
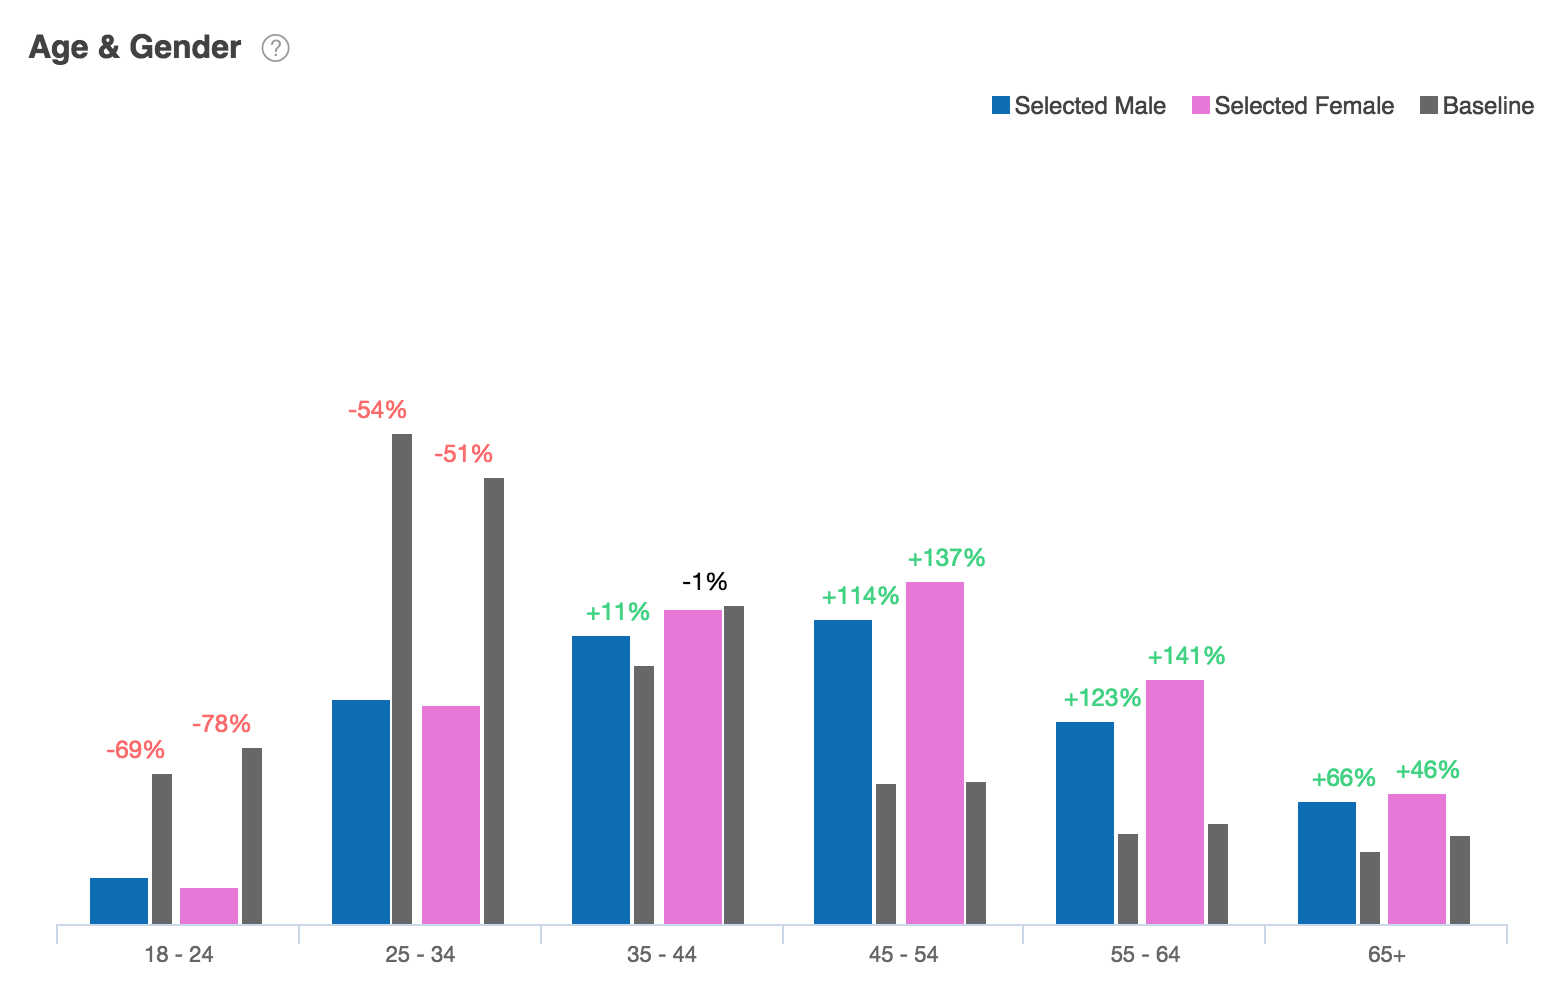
The Age & Gender report shows the distribution of selected users and baseline users by age and gender.
The report may be displayed as a horizontal bar chart, vertical bar chart, or stacked bar chart.
Age & Gender report data is based on previous 30 days of Age & Gender module data. To learn more, see Age and Gender module data sources.
Age
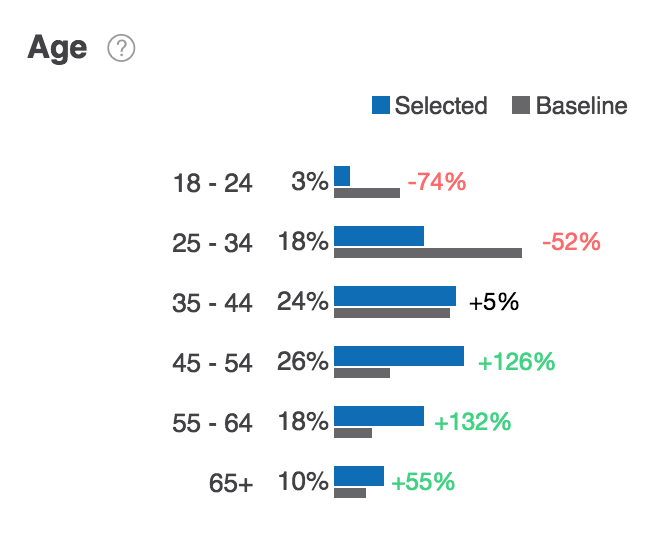
The Age report shows the distribution of selected users and baseline users by age and gender.
The Age report may be displayed as a horizontal bar chart, vertical bar chart, or stacked bar chart.
Age report data is based on previous 30 days of Age & Gender module data. To learn more, see Age and Gender module data sources.
Gender
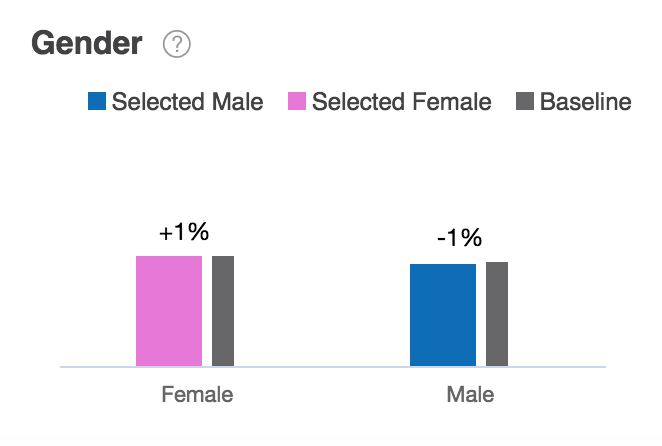
The Gender report shows the distribution of selected users and baseline users by age and gender.
The Gender report may be displayed as a horizontal bar chart, vertical bar chart, or stacked bar chart.
Gender report data is based on previous 30 days of Age & Gender module data. To learn more, see Age and Gender module data sources.
State
The State report shows the distribution of selected audiences by state and relative to baseline audiences by state.
Using controls in the console, you can configure the State report to highlight different aspects of the data:
- The report may be displayed as a horizontal bar chart, vertical bar chart, or stacked bar chart.
- Data may be sorted by affinity, by percentage of selected users, or by percentage of baseline users.
- By default, the report shows the distribution of audiences in the top 15 states. Use the Count dropdown list to choose the number of states displayed.
State report data is based on previous 30 days of Location module data. To learn more, see Location module data sources.
City
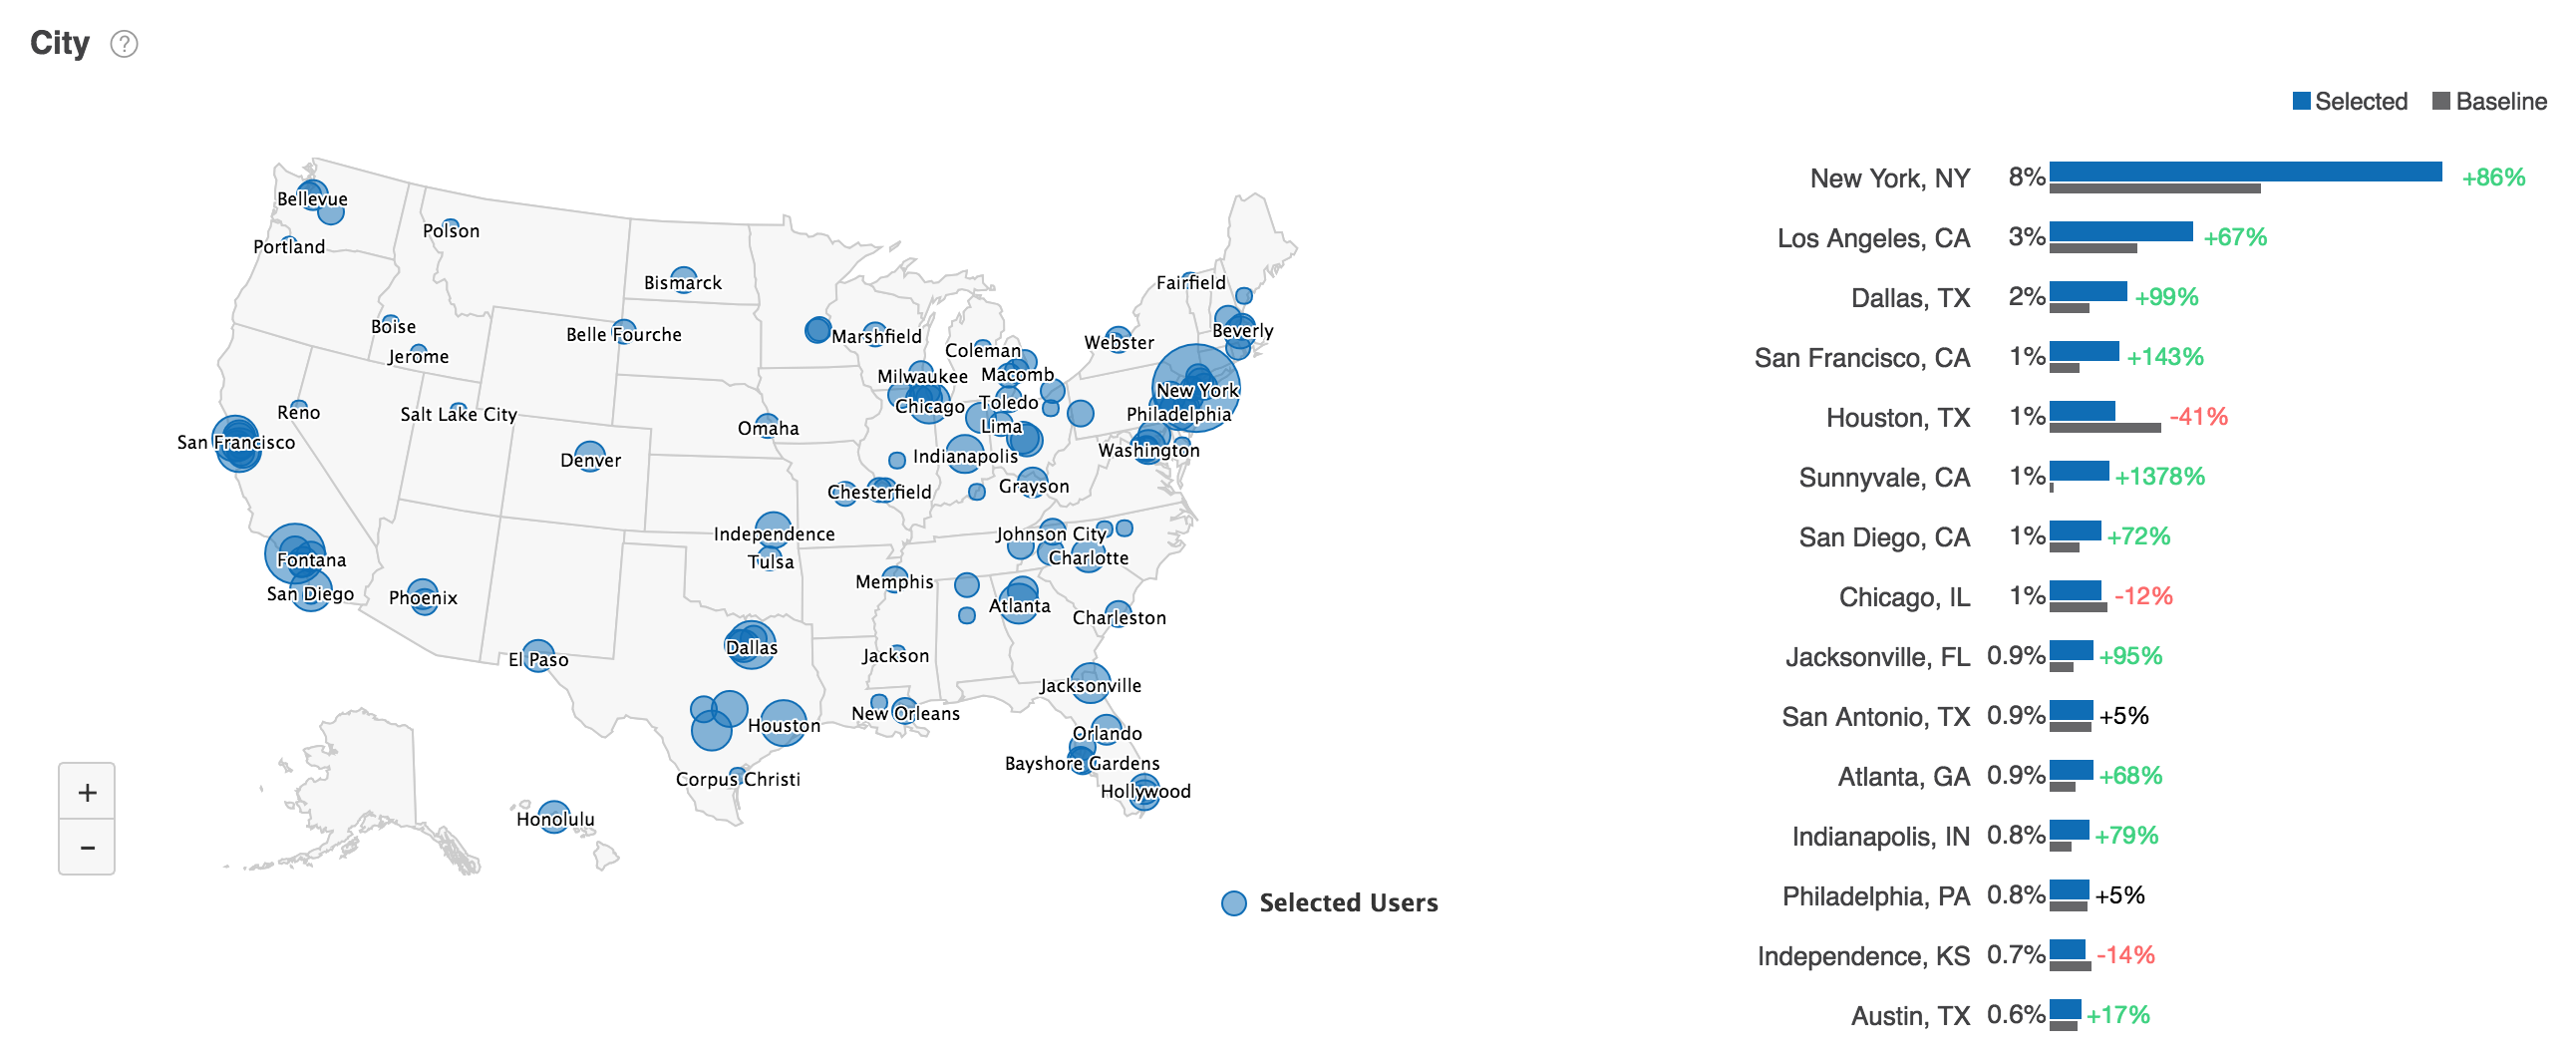
The City report shows the distribution of selected audiences by US city and relative to baseline audiences by city.
Using controls in the console, you can configure the City report to highlight different aspects of the data:
- The report may be displayed as a horizontal bar chart, vertical bar chart, or stacked bar chart.
- Data may be sorted by affinity, by percentage of selected users, or by percentage of baseline users.
- By default, the report shows the distribution of audiences in the top 15 cities. Use the Count dropdown list to choose the number of cities displayed.
City report data is based on previous 30 days of Location module data. To learn more, see Location module data sources.
DMA
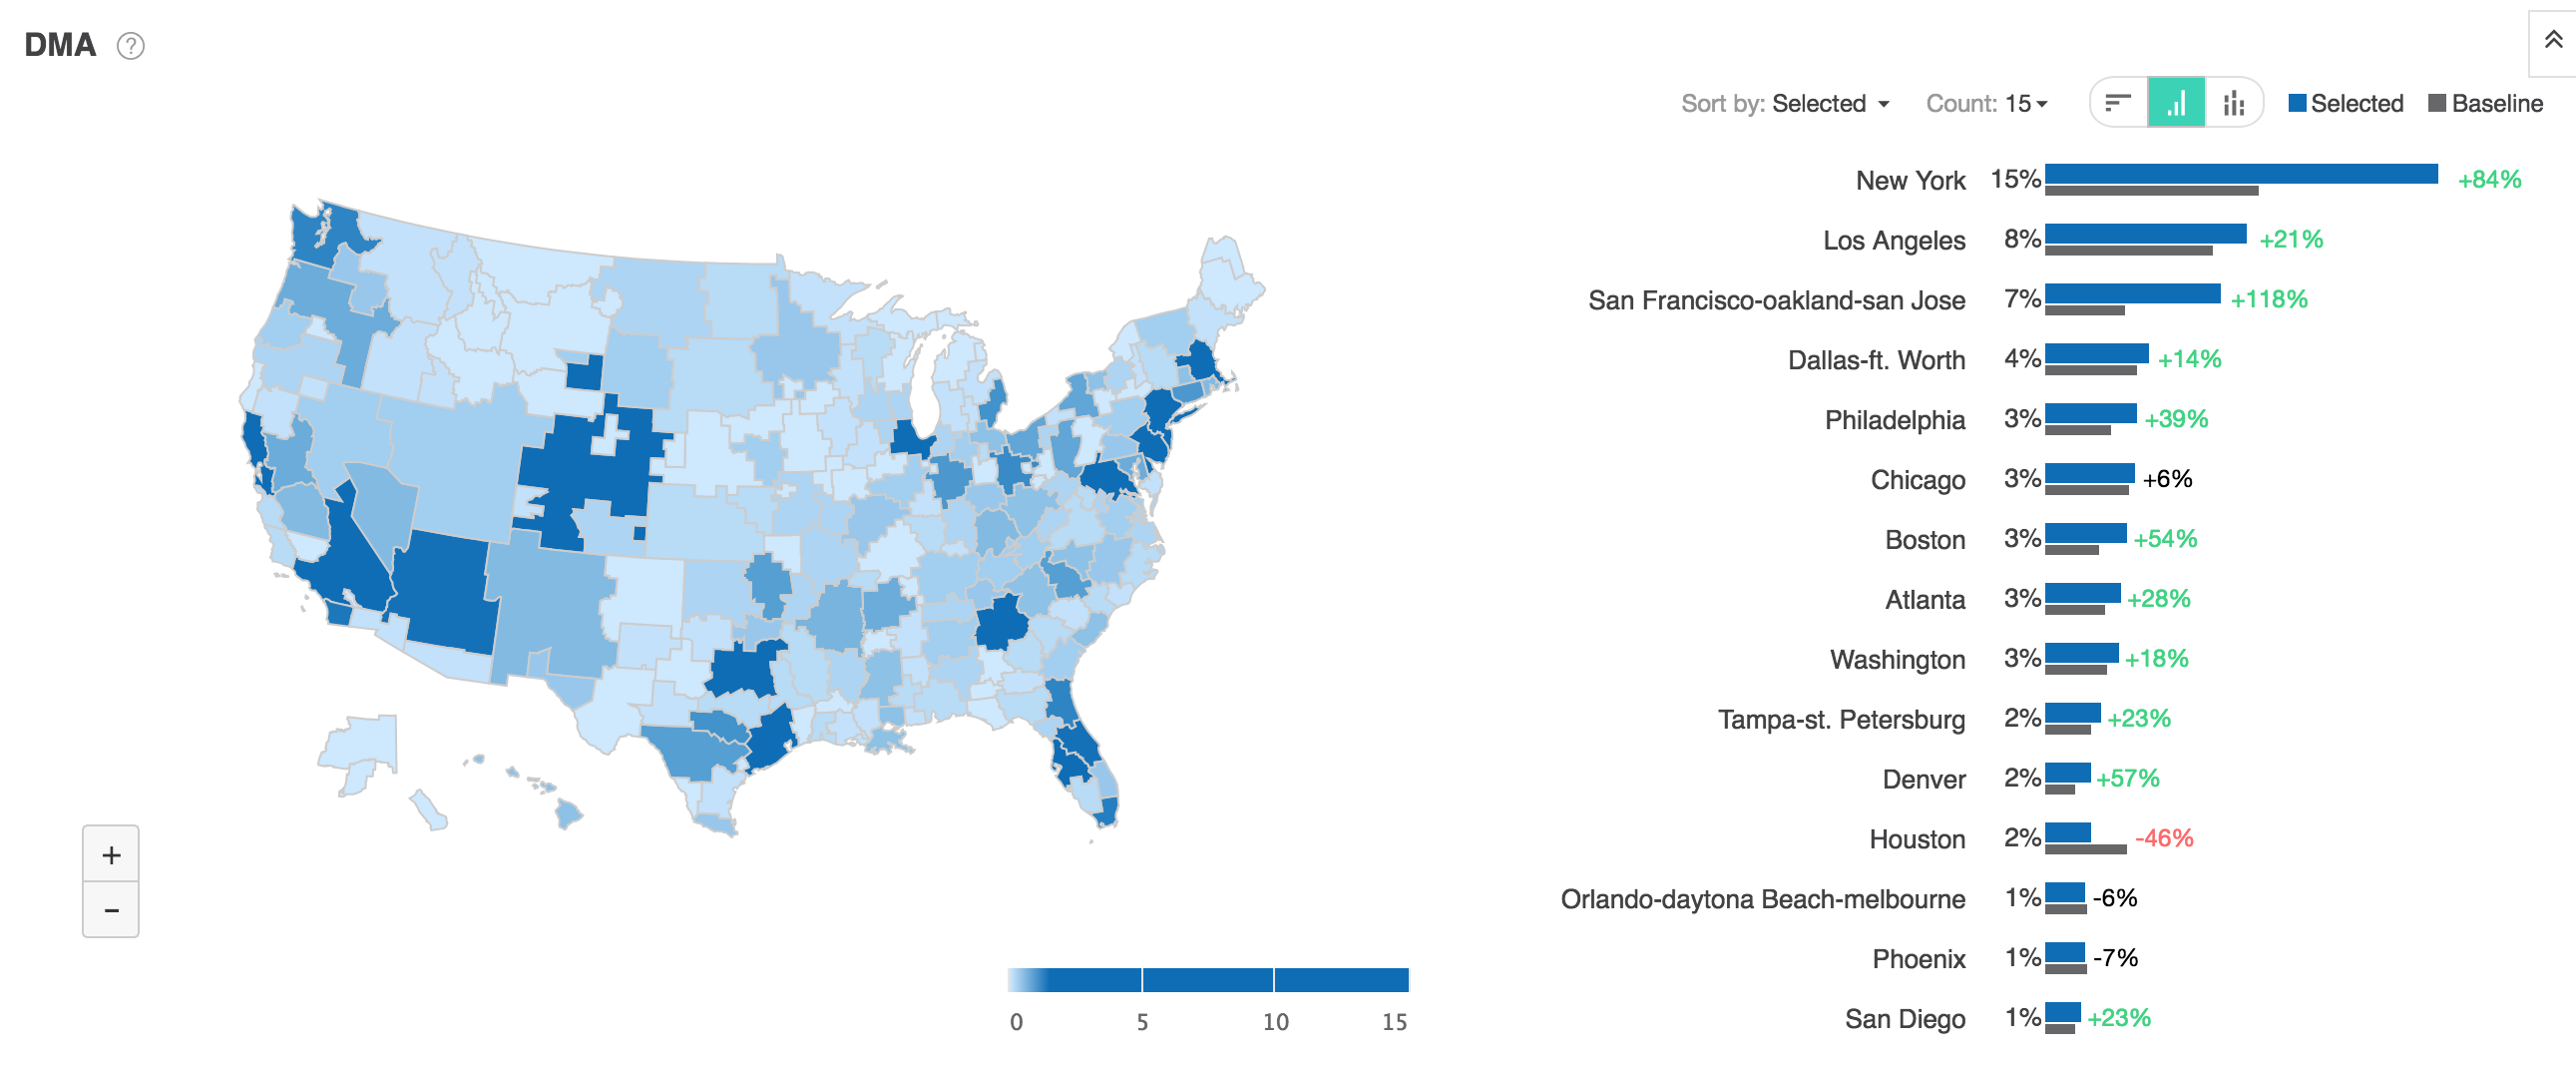
The DMA report shows the distribution of selected audiences by designated marketing area and relative to baseline audiences by DMA.
Using controls in the console, you can configure the DMA report to highlight different aspects of the data:
- The report may be displayed as a horizontal bar chart, vertical bar chart, or stacked bar chart.
- Data may be sorted by affinity, by percentage of selected users, or by percentage of baseline users.
- By default, the report shows the distribution of audiences in the top 15 DMAs. Use the Count dropdown list to choose the number of DMAs displayed.
DMA report data is based on previous 30 days of Location module data. To learn more, see Location module data sources.
Residence Length
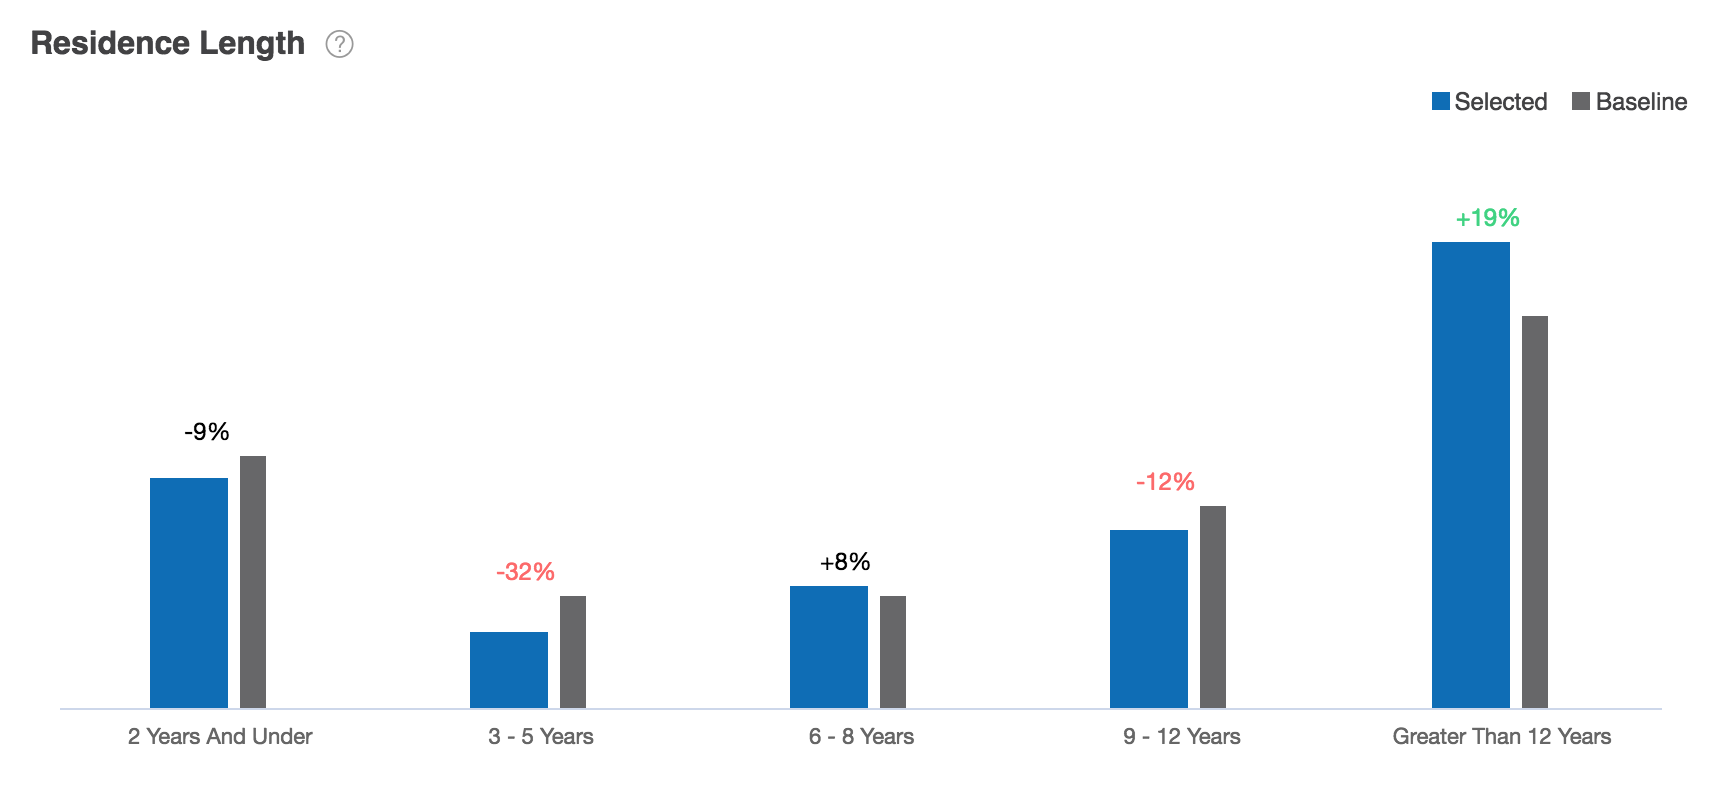
The Residence Length report shows the distribution of selected audiences and baseline audiences by length of stay at current residence.
The Residence Length report may be displayed as a horizontal bar chart, vertical bar chart, or stacked bar chart.
Residence Length report data is based on previous 30 days of Residence module data. To learn more, see Residence module data sources.
Residence Ownership
The Residence Length report shows the distribution of selected audiences and baseline audiences by home owners and renters.
The Residence Ownership report may be displayed as a horizontal bar chart, vertical bar chart, or stacked bar chart.
Residence Ownership report data is based on previous 30 days of Residence module data. To learn more, see Residence module data sources.
Auto Style
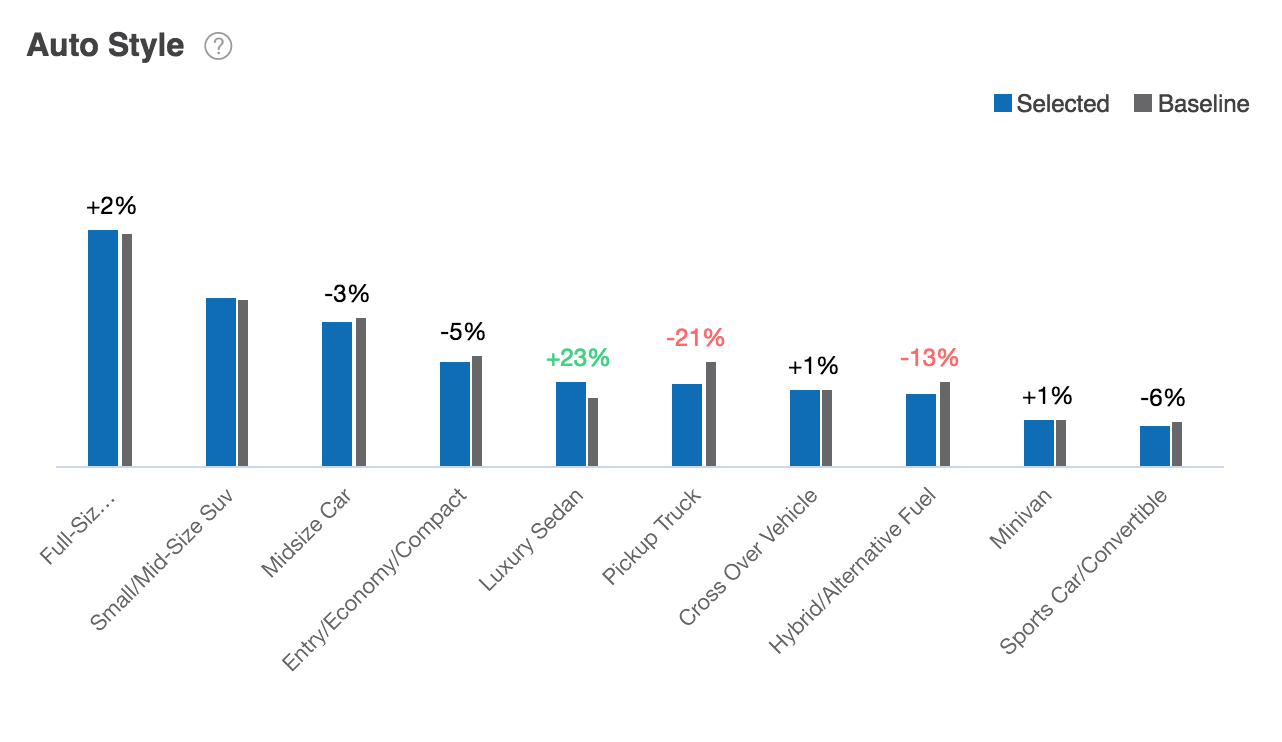
The Auto Style report shows the distribution of selected audience and baseline audiences by automobile style.
Using controls in the console, you can configure the Auto Style report to highlight different aspects of the data:
- The report may be displayed as a horizontal bar chart, vertical bar chart, or stacked bar chart.
- By default, the report shows the distribution of audiences in the top ten auto styles. Use the Count dropdown list to choose the number of auto styles displayed.
Auto Style report data is based on previous 30 days of Auto Ownership module data. To learn more, see Auto Ownership module data sources.
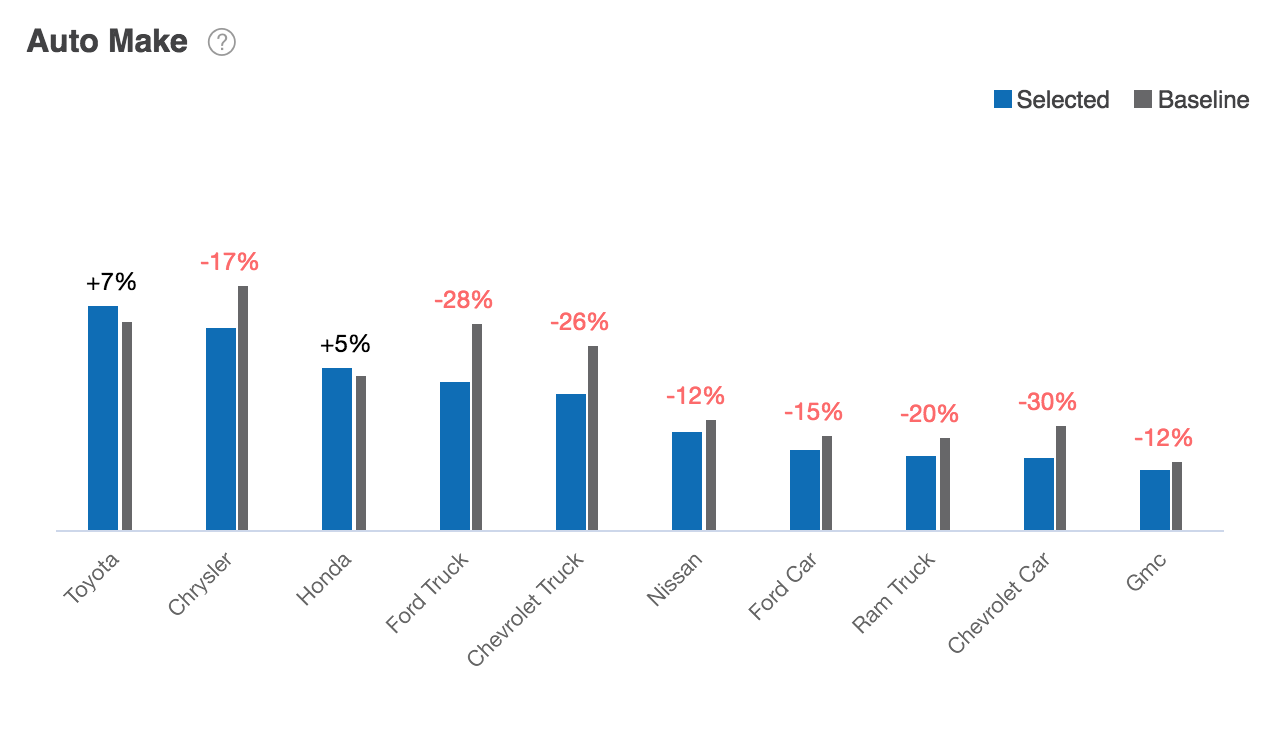
Auto Make
The Auto Make report shows the distribution of selected audience and baseline audiences by the make of the automobile.
Using controls in the console, you can configure the Auto Make report to highlight different aspects of the data:
- The report may be displayed as a horizontal bar chart, vertical bar chart, or stacked bar chart.
- Data can be sorted by affinity, by selected users, or by baseline users.
- By default, the report shows the distribution of audiences in the top ten auto makes. Use the Count dropdown list to choose the number of auto makes displayed.
Auto Make report data is based on previous 30 days of Auto Ownership module data. To learn more, see Auto Ownership module data sources.
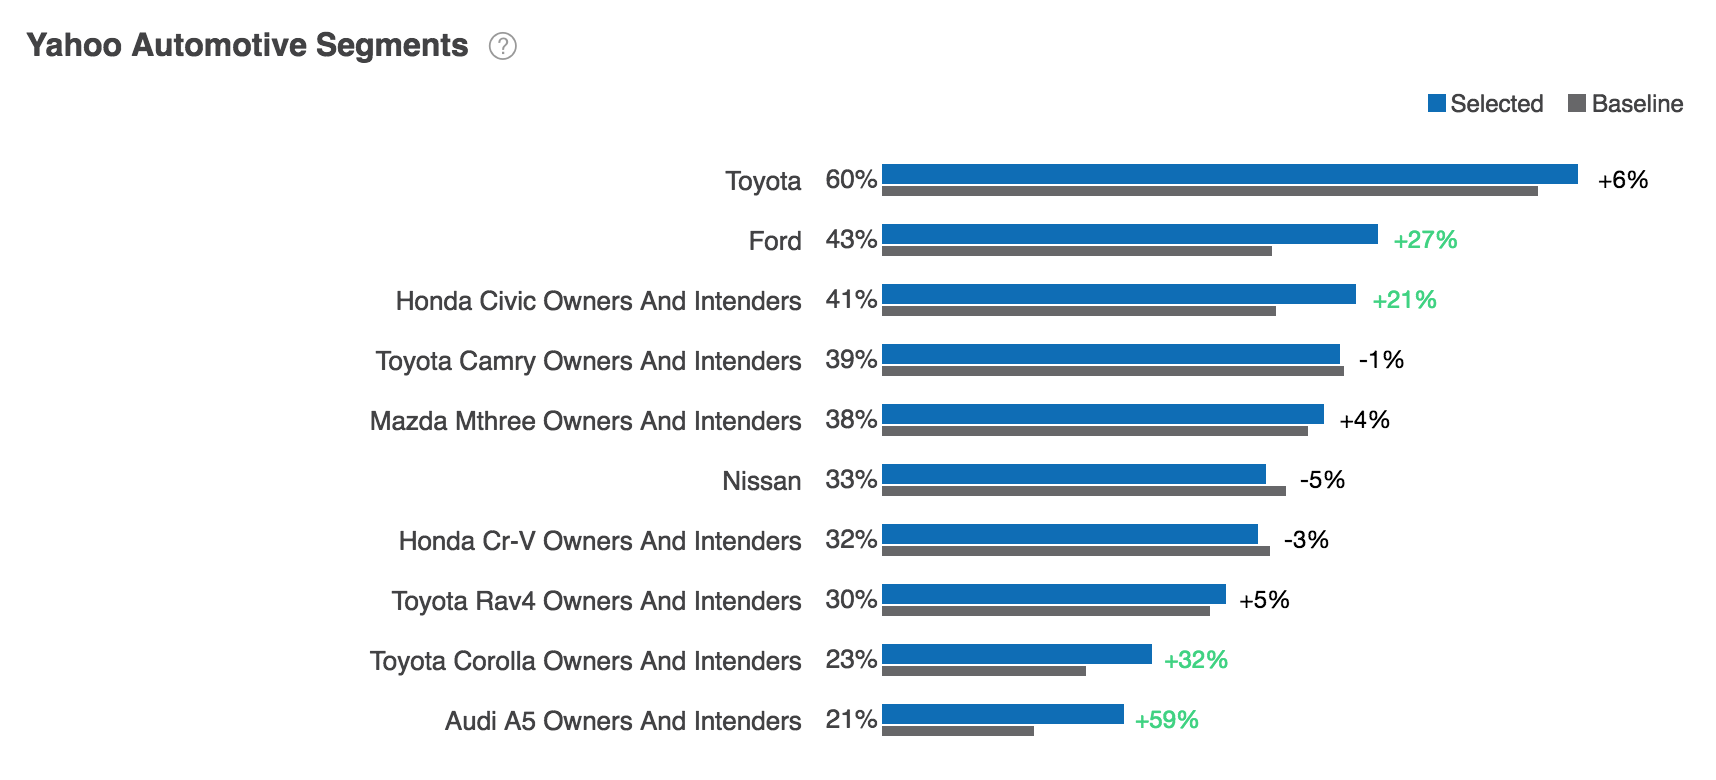
Yahoo Automotive Segments
The Yahoo Automotive Segments reports shows the distribution of selected and baseline audiences by Yahoo Automotive Segment.
Using controls in the console, you can configure the Yahoo Automotive Segments report to highlight different aspects of the data:
- The report may be displayed as a horizontal bar chart, vertical bar chart, or stacked bar chart.
- Data can be sorted by affinity, by selected users, or by baseline users.
- By default, the report shows the distribution of audiences in the top ten Yahoo Automotive Segments. Use the Count dropdown list to choose the number of Yahoo Automotive Segments displayed.
Yahoo Automotive Segments report data is based on previous 30 days of Auto Ownership module data. To learn more, see Auto Ownership module data sources.
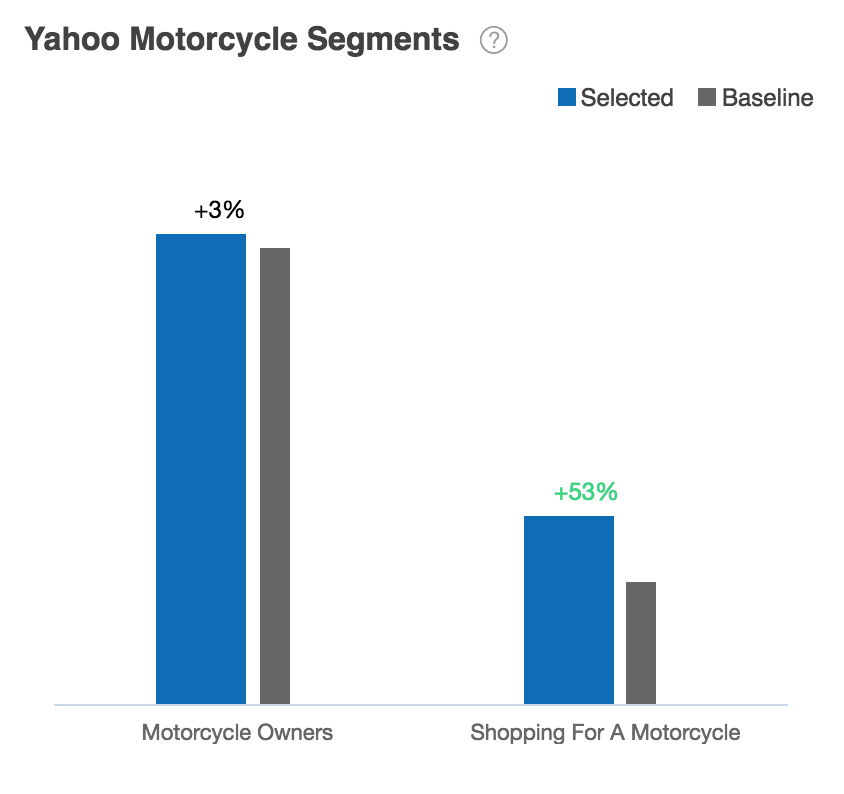
Yahoo Motorcycle Segments
The Yahoo Motorcycle Segments reports shows the distribution of selected and baseline audiences by motorcycle ownership.
Using controls in the console, you can configure the Yahoo Motorcycle Segments report to highlight different aspects of the data:
- The report may be displayed as a horizontal bar chart, vertical bar chart, or stacked bar chart.
- Data can be sorted by affinity, by selected users, or by baseline users.
- By default, the report shows the distribution of audiences in the top ten Yahoo Motorcycle Segments. Use the Count dropdown list to choose the number of Yahoo Motorcycle Segments displayed.
Yahoo Motorcycle Segments report data is based on previous 30 days of Auto Ownership module data. To learn more, see Auto Ownership module data sources.
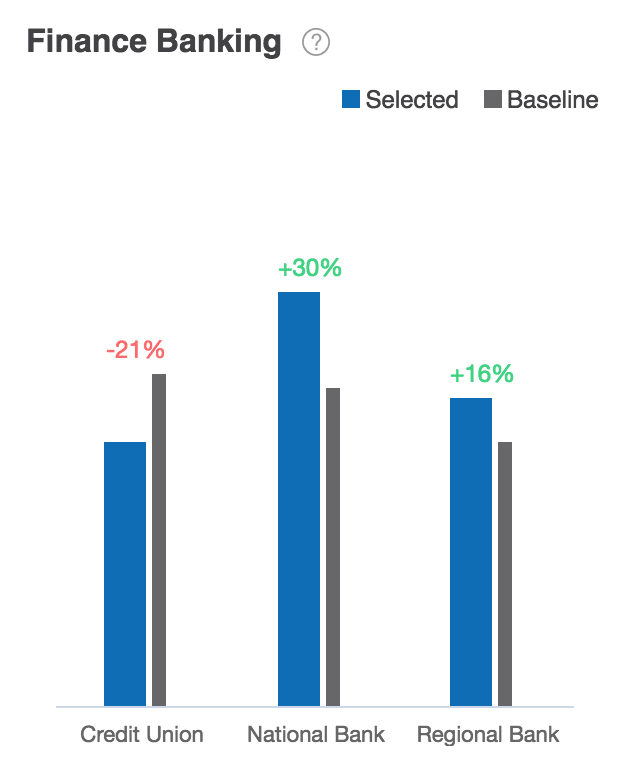
Finance Banking
The Finance Banking report shows the distribution of selected and baseline audiences by banking method.
The report may be displayed as a horizontal bar chart, vertical bar chart, or stacked bar chart.
Finance Banking report data is based on previous 30 days of Finance module data. To learn more, see Finance module data sources.
Finance Spending
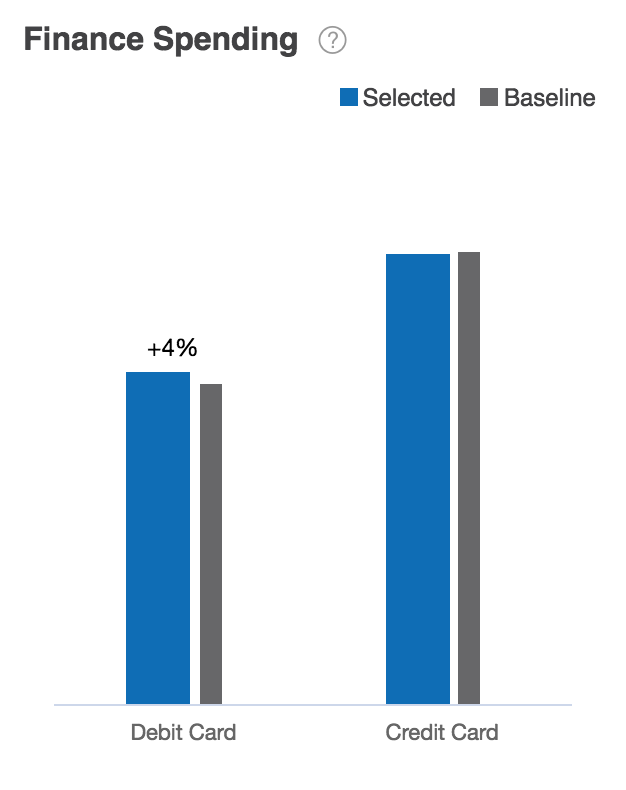
The Finance Spending report shows the distribution of selected and baseline audiences by spending profile.
The report may be displayed as a horizontal bar chart, vertical bar chart, or stacked bar chart.
Finance Spending report data is based on previous 30 days of Finance module data. To learn more, see Finance module data sources.
Finance Stock Searched
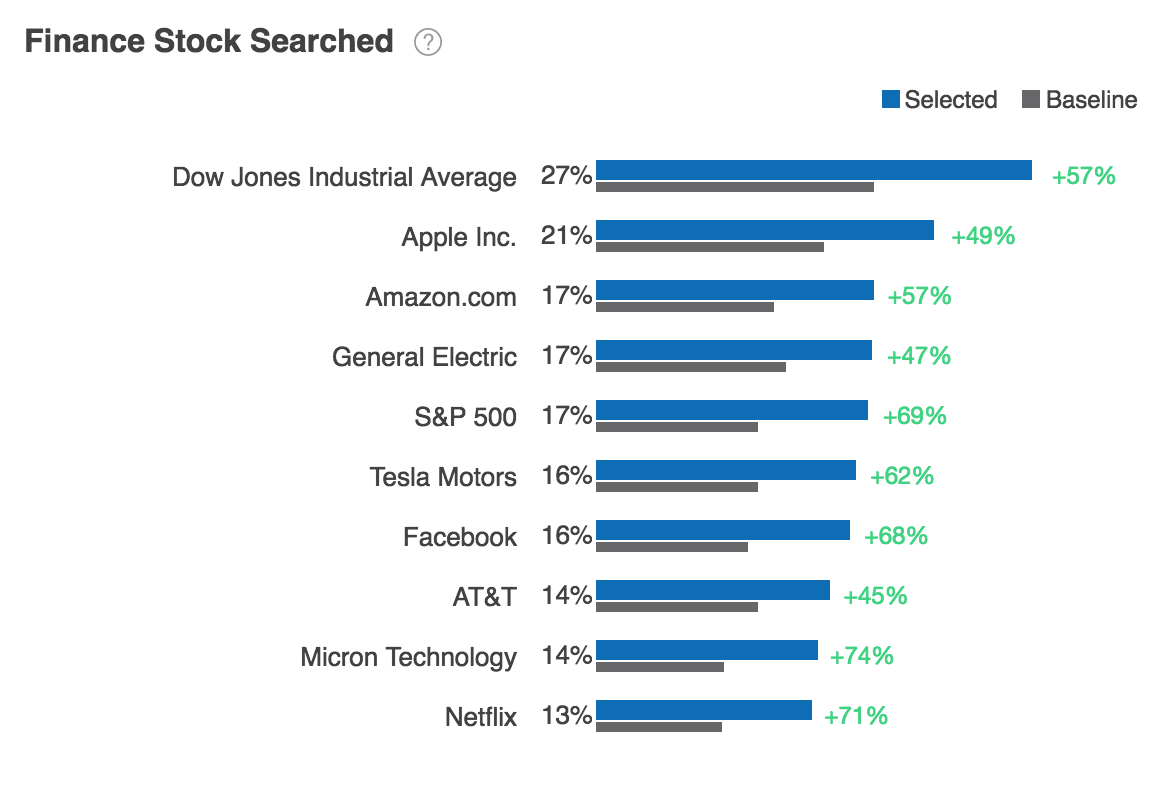
The Finance Stock Searched report shows the distribution of selected users and baseline users by stock market searches.
Using controls in the console, you can configure the Finance Stock Searched report to highlight different aspects of the data:
- The report may be displayed as a horizontal bar chart, vertical bar chart, or stacked bar chart.
- By default, the report shows the distribution of audiences across the top ten stock searches. Use the Count dropdown list to choose the number of stock searches displayed.
Finance Stock Searched report data is based on previous 30 days of Finance module data. To learn more, see Finance module data sources.
Income Distribution
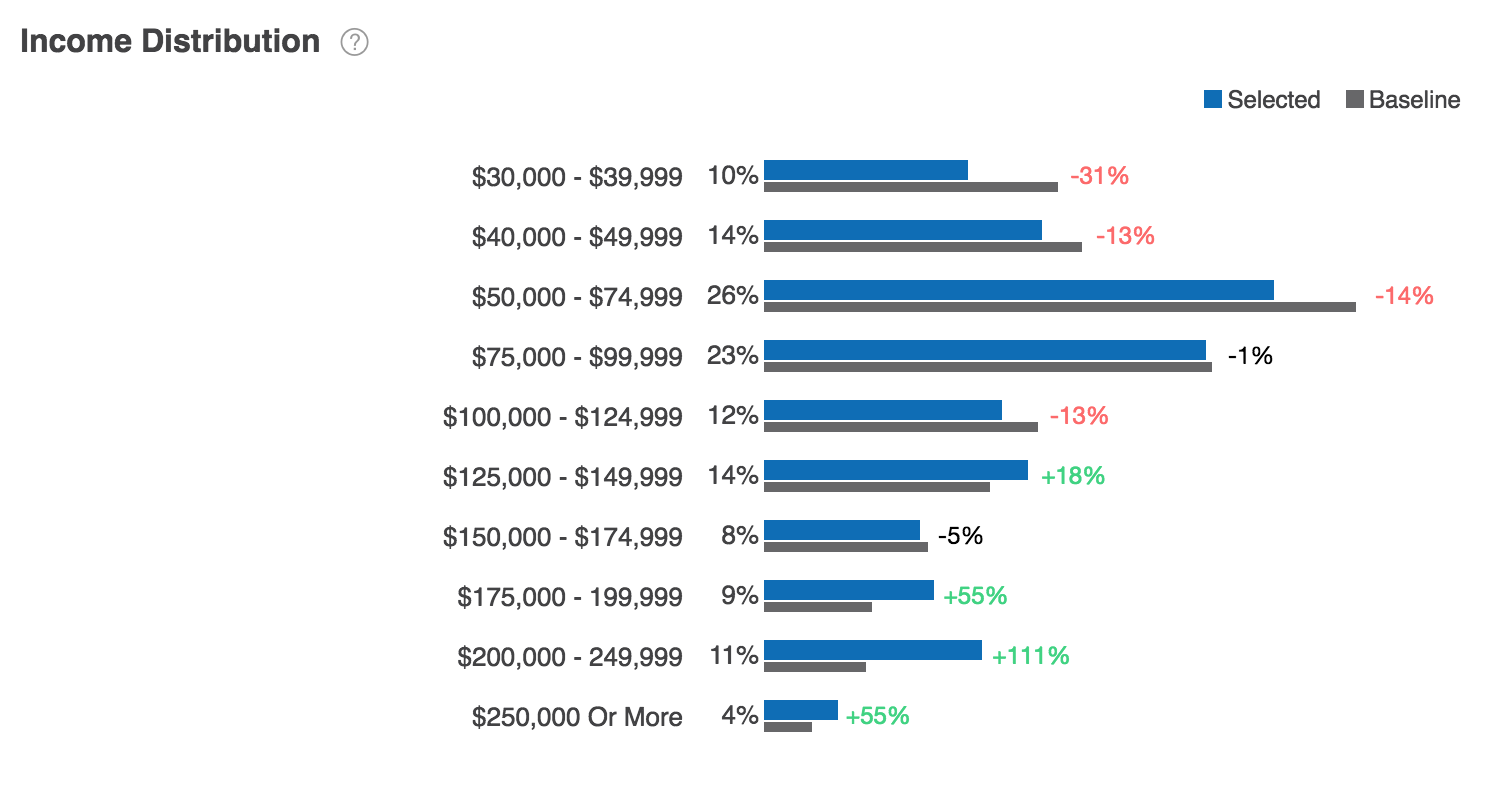
The Income Distribution report shows the distribution of selected and baseline audiences by their household income.
The report may be displayed as a horizontal bar chart, vertical bar chart, or stacked bar chart.
Income Distribution report data is based on previous 30 days of Income Distribution module data. To learn more, see Income Distribution module data sources.
Home Market Value
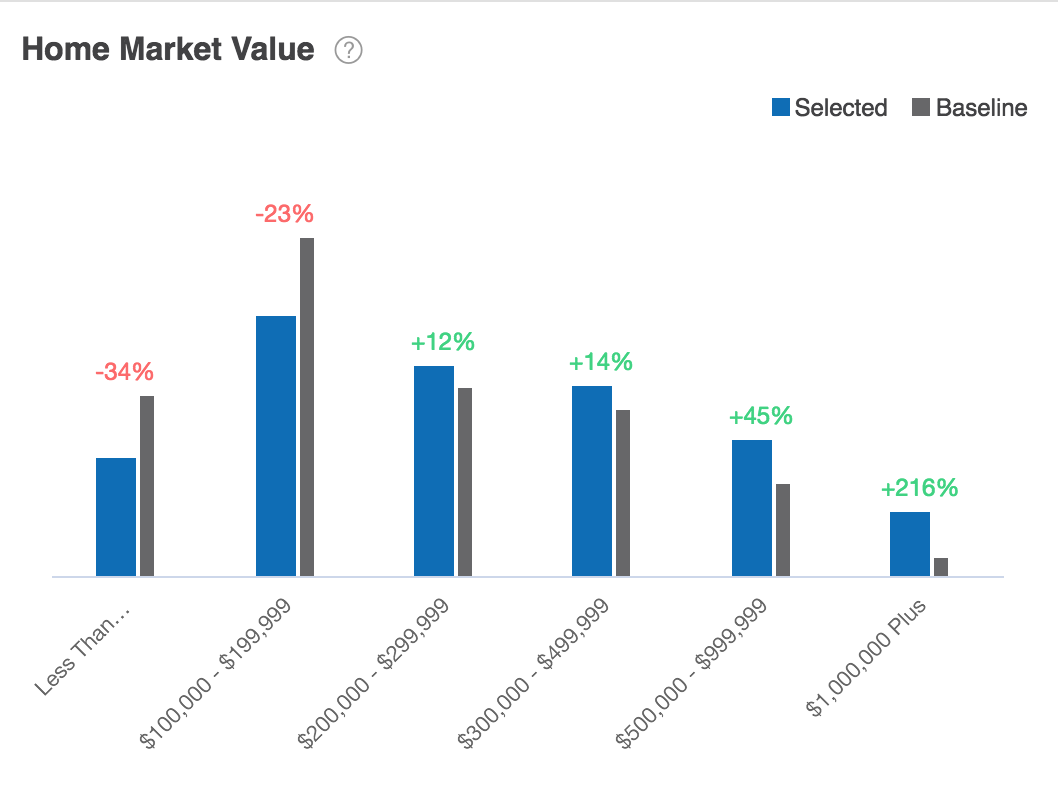
The Home Market Value report shows the distribution of selected and baseline audiences by the market value of homes.
The report may be displayed as a horizontal bar chart, vertical bar chart, or stacked bar chart.
Home Market Value report data is based on previous 30 days of Home Market Value module data. To learn more, see Home Market Value module data sources.
Life Stage
The Life Stage report shows the distribution of selected and baseline audiences by the life stage.
The report may be displayed as a horizontal bar chart, vertical bar chart, or stacked bar chart.
Life Stage report data is based on previous 30 days of Life Stage module data. To learn more, see Life Stage module data sources.
Life Stage Parents
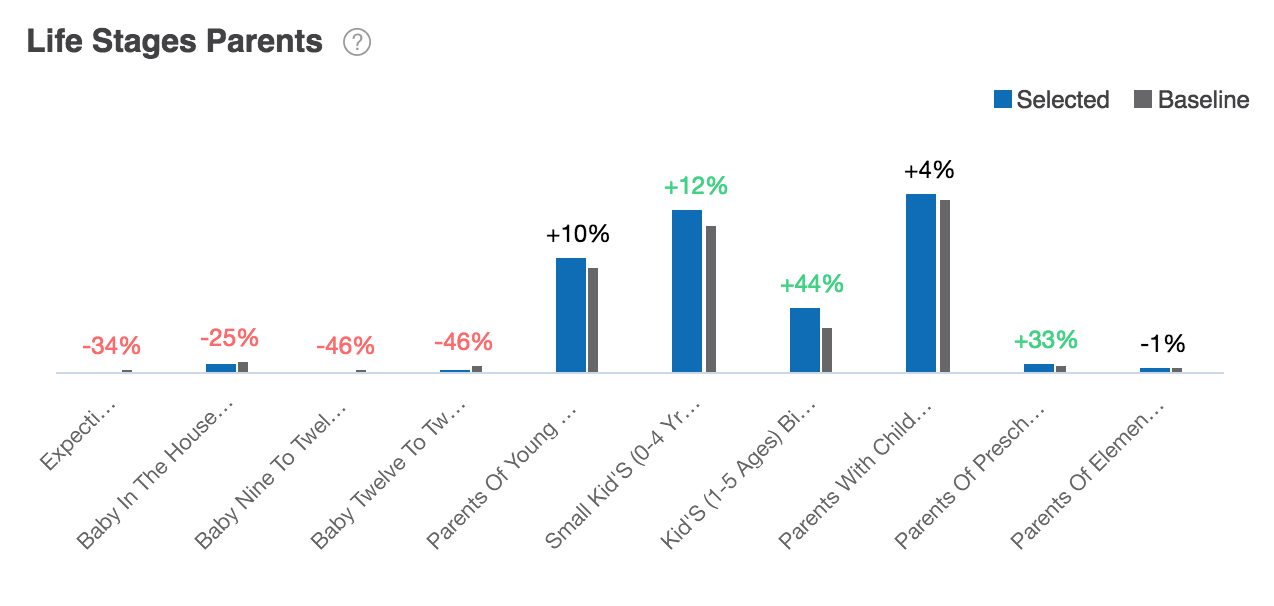
The Life Stage Parents report shows the distribution of selected and baseline audiences by the life stage of their parents.
Using controls in the console, you can configure the Life Stage Parents report to highlight different aspects of the data:
- The report may be displayed as a horizontal bar chart, vertical bar chart, or stacked bar chart.
- By default, the report shows the distribution of audiences in the top ten life stages. Use the Count dropdown list to choose the number of life stages displayed.
Life Stage Parents report data is based on previous 30 days of Life Stage module data. To learn more, see Life Stage module data sources.
