Purchase Insights
Overview
Purchase Insights reports enable you to compare profiled audiences across multiple purchase insight category modules.
Each module is represented by a distinct report that enables you to view the affinity of the profiled selected users and baseline users.
By default, the baseline is a set of all known users. The baseline can be configured by selecting the Baseline tab on the left pane.
The Audience Insights console displays the following purchase reports:
|
|
|
Purchase Categories (Level 1)
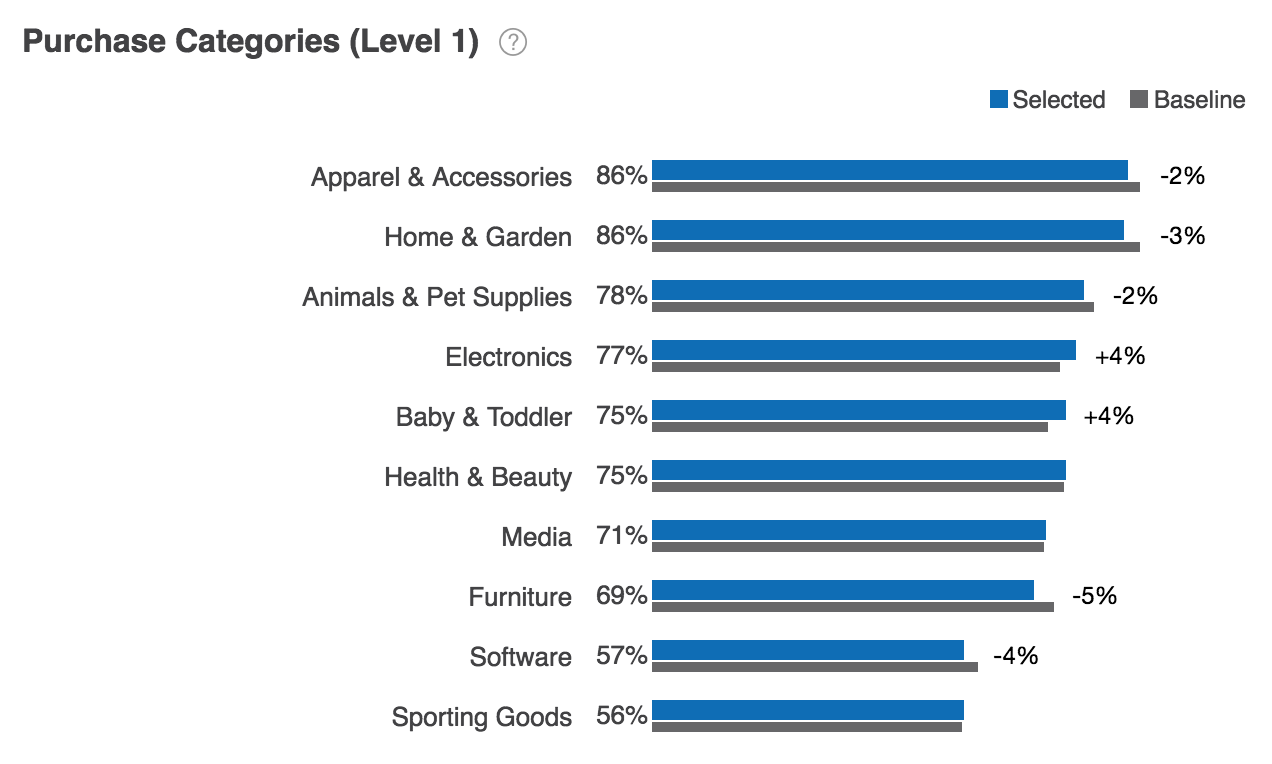
The Purchase Categories report shows the distribution of top selected purchase categories such as pet supplies, clothing, shoes, and jewelry for selected purchasers compared against the baseline set of purchasers.
Using controls in the console, you can configure the Purchase Categories (Level 1) report to highlight different aspects of the data:
- The report may be displayed as a horizontal bar chart, vertical bar chart, or stacked bar chart.
- Data may be sorted by affinity, by percentage of selected users, or by percentage of baseline users.
- By default, the report shows the distribution of audiences across ten level 1 purchase categories. Use the Count dropdown list to choose the number of purchase categories displayed.
Purchase Categories (Level 1) report data is based on previous 30 days of POI data. To learn more, see Purchase Categories module data sources.
Purchase Categories (Level 2)
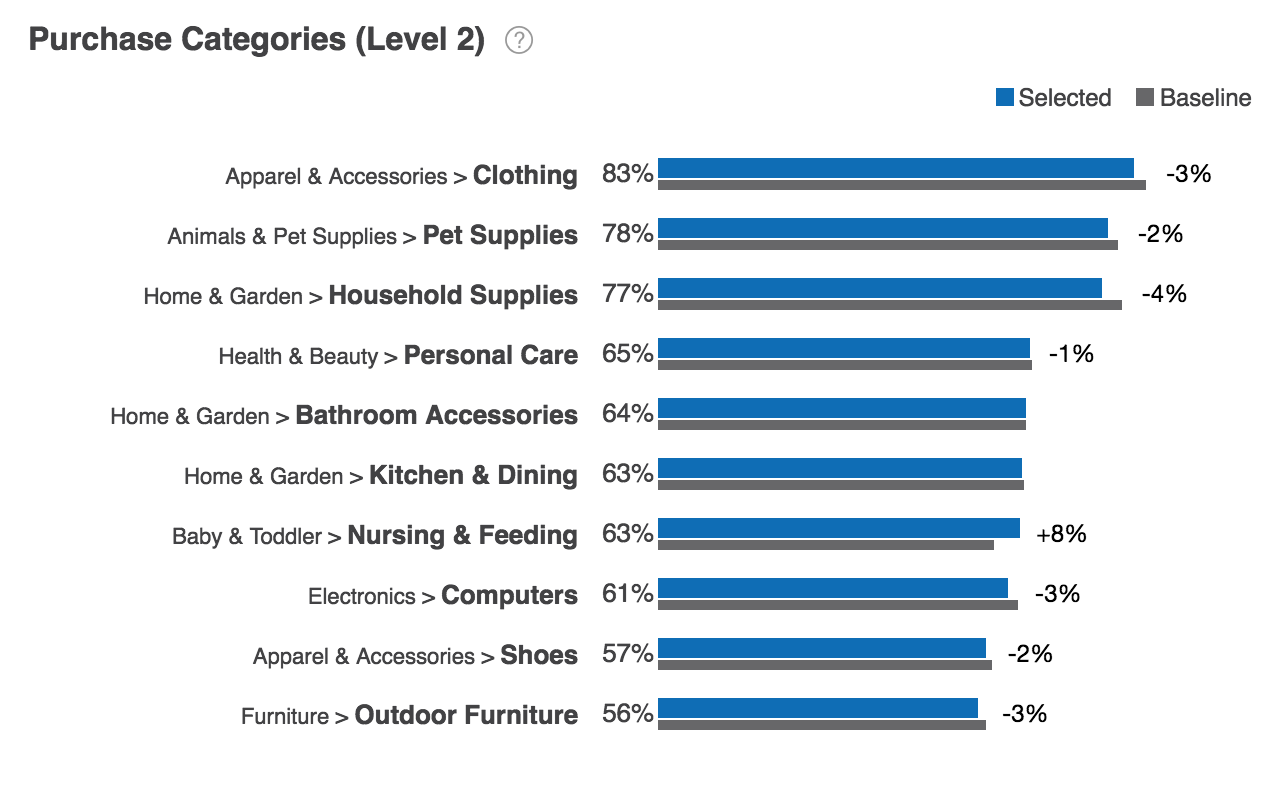
Level 2 represents the second level of the Amazon Purchase category taxonomy.
Using controls in the console, you can configure the Purchase Categories (Level 2) report to highlight different aspects of the data:
- The report may be displayed as a horizontal bar chart, vertical bar chart, or stacked bar chart.
- Data may be sorted by affinity, by percentage of selected users, or by percentage of baseline users.
- By default, the report shows the distribution of audiences across ten level 2 purchase categories. Use the Count dropdown list to choose the number of purchase categories displayed.
Purchase Categories (Level 2) report data is based on previous 30 days of POI data. To learn more, see Purchase Categories module data sources.
Age & Gender for Purchases
The Age and Gender for Purchases report shows the distribution of selected users and baseline users by age and gender.
Age & Gender for Purchases report data is based on previous 30 days of Purchase Category module data. To learn more, see Purchase Categories module data sources.
Age for Purchases
The Age for Purchases report shows the distribution of selected users and baseline users by age.
The Age for Purchases report may be displayed as a horizontal bar chart, vertical bar chart, or stacked bar chart.
Age for Purchases report data is based on previous 30 days of Purchase Category module data. To learn more, see Purchase Categories module data sources.
Gender for Purchases
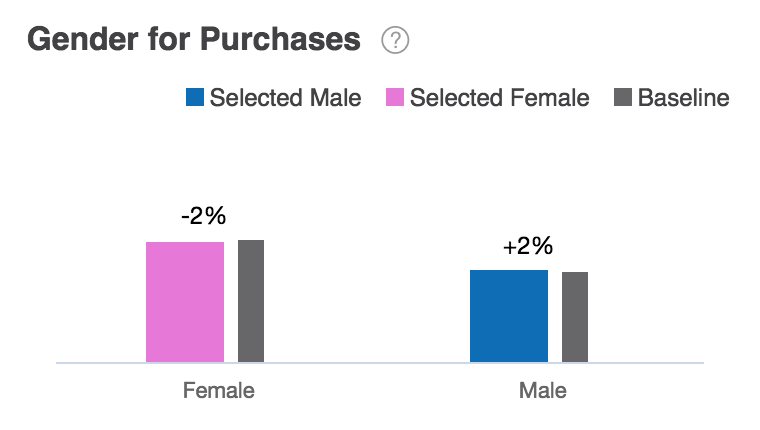
The Gender for Purchases report shows the distribution of selected users and baseline users by gender.
The Gender for Purchases report may be displayed as a horizontal bar chart, vertical bar chart, or stacked bar chart.
Gender for Purchases report data is based on previous 30 days of Purchase Category module data. To learn more, see Purchase Categories module data sources.
Top Selling Products (Frequent)
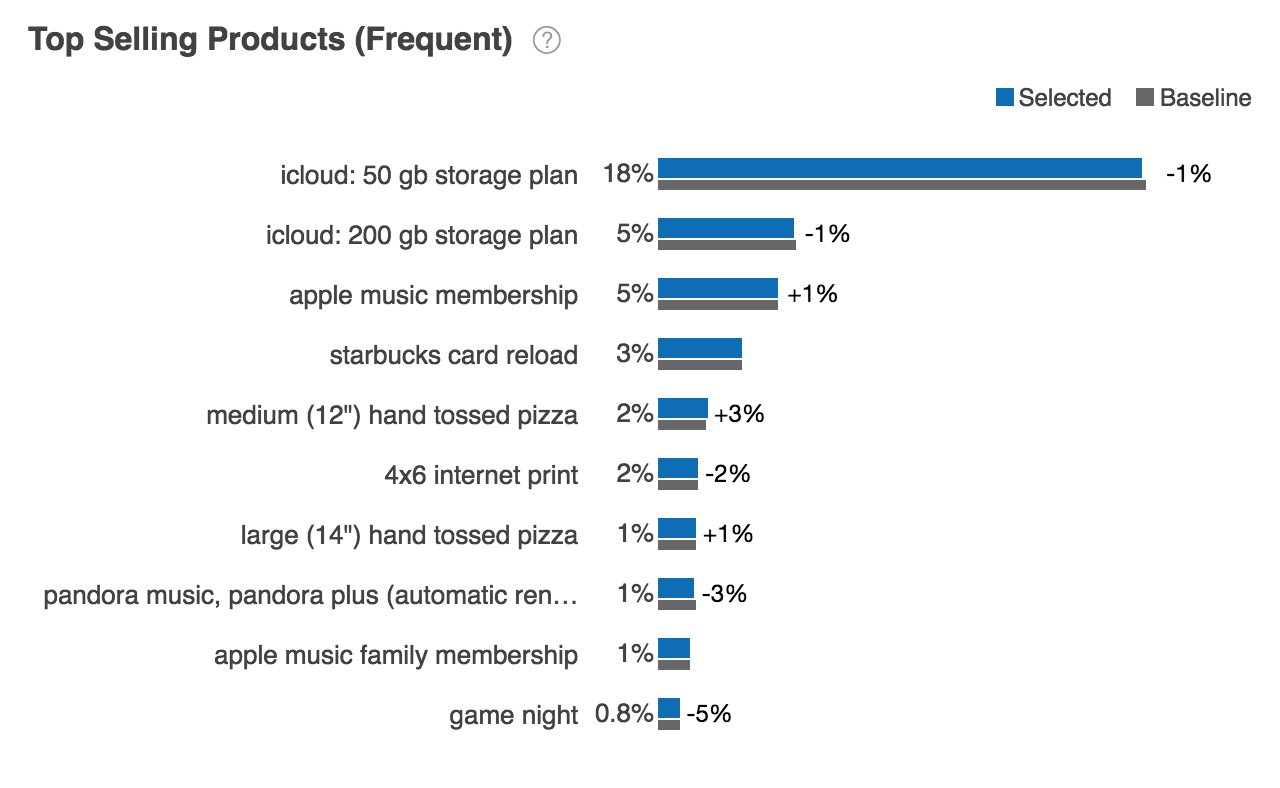
The Top Selling Products (Frequent) report shows the distribution of selected users and baseline users by product.
Using controls in the console, you can configure the Top Selling Products (Frequent) report to highlight different aspects of the data:
- The report may be displayed as a horizontal bar chart, vertical bar chart, or stacked bar chart.
- Data may be sorted by affinity, by percentage of selected users, or by percentage of baseline users.
- By default, the report shows the distribution of audiences across ten relevant top selling products. Use the Count dropdown list to choose the number of products displayed.
Top Selling Products (Frequent) report data is based on previous 30 days of Top Selling Products module data. To learn more, see Top Selling Products module data sources.
Top Selling Products (Relevant)
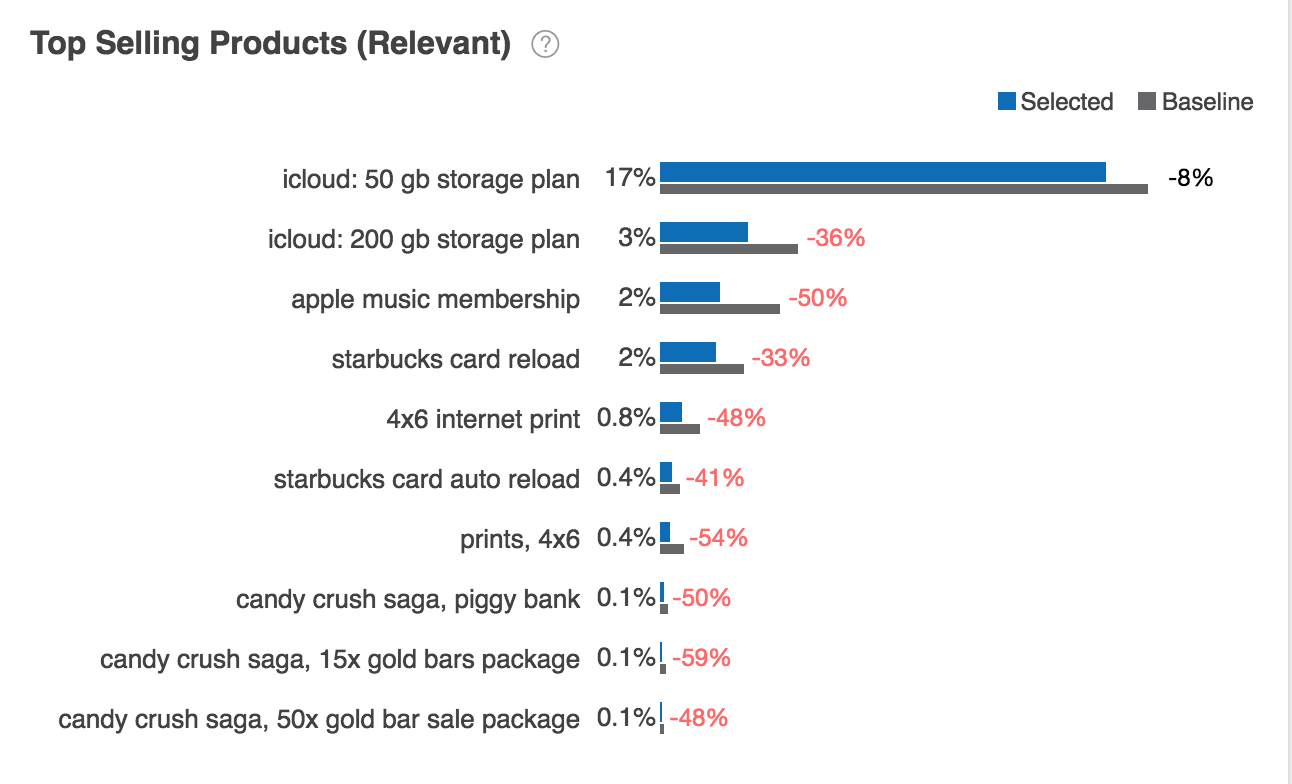
The Top Selling Products (Relevant) report shows the distribution of selected users and baseline users by product.
Using controls in the console, you can configure the Top Selling Products (Relevant) report to highlight different aspects of the data:
- The report may be displayed as a horizontal bar chart, vertical bar chart, or stacked bar chart.
- Data may be sorted by affinity, by percentage of selected users, or by percentage of baseline users.
Top Selling Products (Matched) report data is based on previous 30 days of Top Selling Products module data. To learn more, see Top Selling Products module data sources.
Top Selling Products (Matched)
The Top Selling Products (Matched) report shows the distribution of selected users and baseline users by product.
Using controls in the console, you can configure the Top Selling Products (Relevant) report to highlight different aspects of the data:
- The report may be displayed as a horizontal bar chart, vertical bar chart, or stacked bar chart.
- Data may be sorted by affinity, by percentage of selected users, or by percentage of baseline users.
- By default, the report shows the distribution of audiences across ten relevant top selling products. Use the Count dropdown list to choose the number of products displayed.
Top Selling Products (Relevant) report data is based on previous 30 days of Purchase Category module data. To learn more, see Top Selling Products module data sources.
Top Selling Domains
The Top Selling Domains report shows the distribution of top selling web domains such as walmart.com and kohls.com for selected purchasers compared against a baseline set of purchasers.”
Using controls in the console, you can configure the Top Selling Domains report to highlight different aspects of the data:
- The report may be displayed as a horizontal bar chart, vertical bar chart, or stacked bar chart.
- Data may be sorted by affinity, by percentage of selected users, or by percentage of baseline users.
- By default, the report shows the distribution of audiences across ten top selling domains. Use the Count dropdown list to choose the number of domains displayed.
Top Selling Domains report data is based on previous 30 days of Top Selling Domains module data. To learn more, see Top Selling Domains module data sources.
Payment Method
The Payment Method report shows the distribution of profiled selected users and baseline by payment method.
The Payment Method report may be displayed as a horizontal bar chart, vertical bar chart, or stacked bar chart.
Payment Method report data is based on previous 30 days of Payment Method module data. To learn more, see Payment Method module data sources.
Event Types
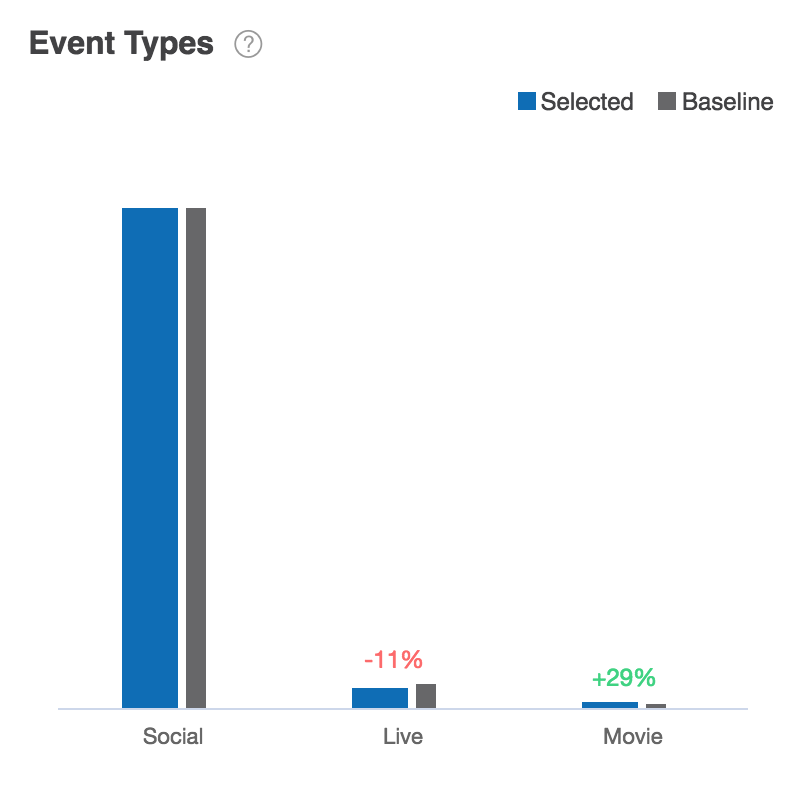
The Event Type report shows the distribution of profiled selected users and baseline by event type.
The Event Types report may be displayed as a horizontal bar chart, vertical bar chart, or stacked bar chart.
Event Types report data is based on previous 30 days of Event Types module data. To learn more, see Event Types module data sources.
Movie Events
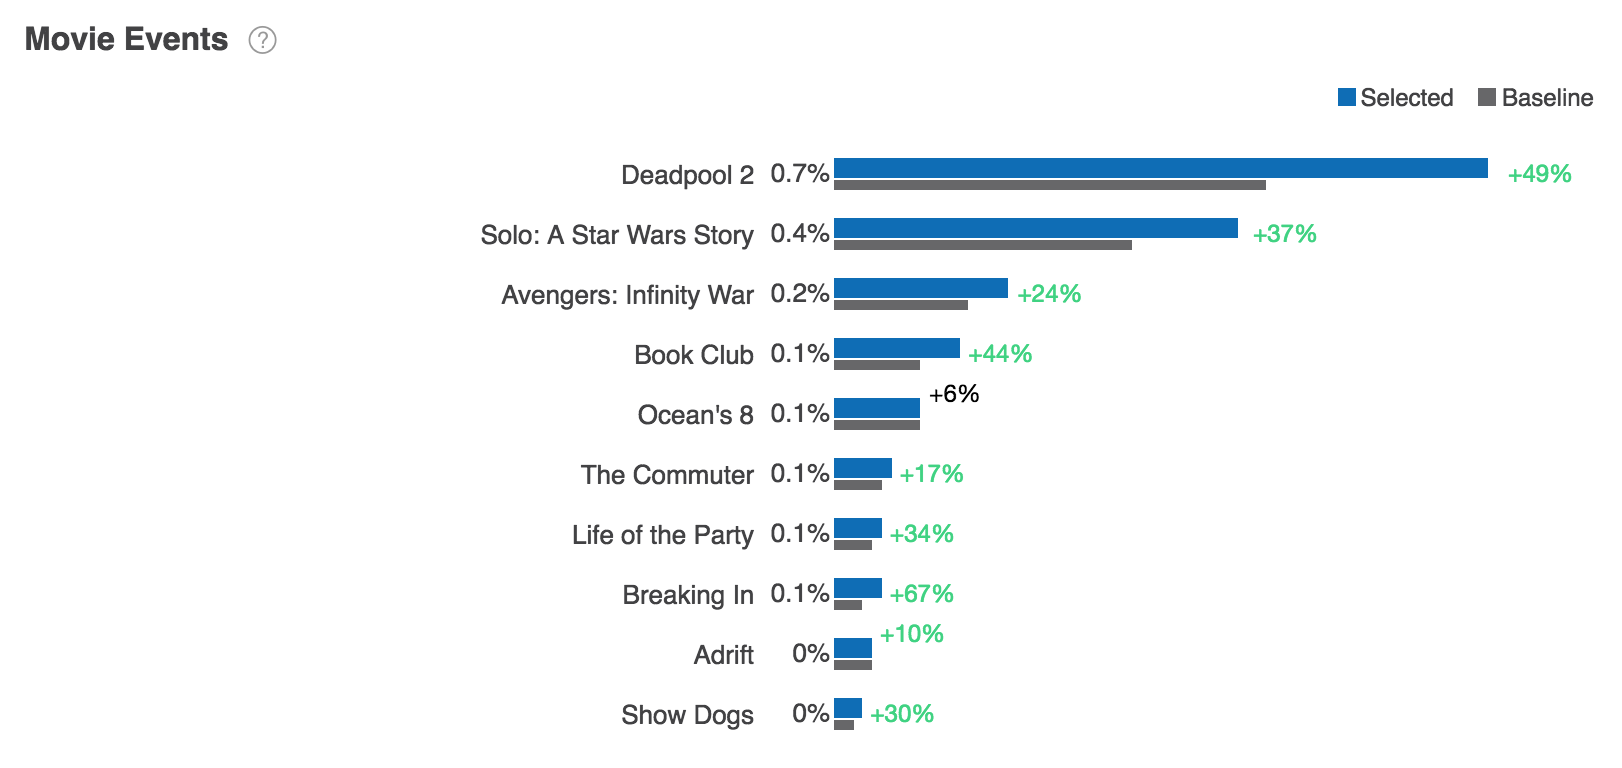
The Movie Events report shows the distribution of profiled selected users and baseline by movie.
Using controls in the console, you can configure the Movie Events report to highlight different aspects of the data:
- The report may be displayed as a horizontal bar chart, vertical bar chart, or stacked bar chart.
- Data may be sorted by affinity, by percentage of selected users, or by percentage of baseline users.
Movie Events report data is based on previous 30 days of Movie Events module data. To learn more, see Movie Events module data sources.
Live Events
The Live Event report shows the distribution of profiled selected users and baseline by live event.
Data can be sorted by affinity, by percentage of selected users or baseline users, or alphabetically by live event.
The Live Events report may be displayed as a horizontal bar chart, vertical bar chart, or stacked bar chart.
Live Events report data is based on previous 30 days of Live Events module data. To learn more, see Live Events module data sources.

