Travel Insights
Overview
Investigating the Travel behavior of users provides insight into what hotels selected uses will stay at, what Airlines they are most likely to use, what booking providers they use, and where they will travel to. This is useful for travel advertisers, as recommendations can be made on audience targeting strategies.
Travel Insights reports enable you to compare profiled audiences across multiple Travel category modules. Each module is represented by a distinct report that enables you to view the affinity of the profiled selected users and baseline users.

Fig. 77 Travel Insights Reports
This article shows how you can use various travel insight reports to better understand what differentiates a profiled audience from general users or from a profiled baseline audience.
The Audience Insights console displays the following travel reports:
|
|
|
Top Hotels
The Top Hotels travel report shows the distribution of profiled selected users and baseline users by top hotels booked.
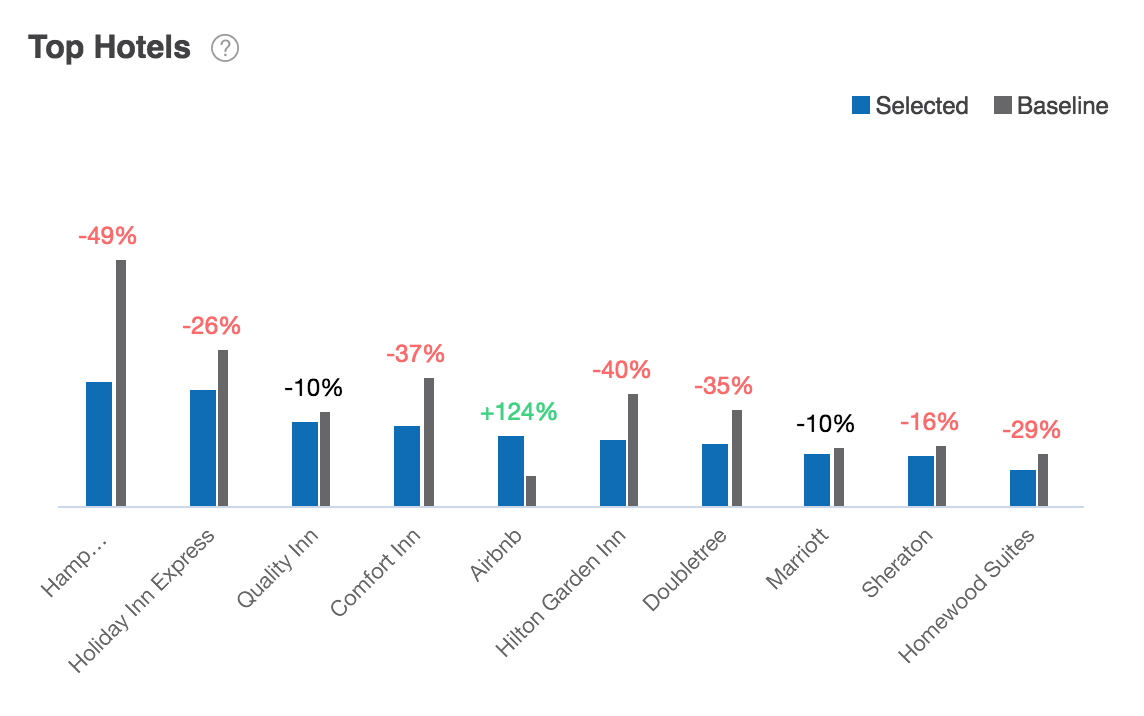
Fig. 78 Top Hotels Report
Using controls in the console, you can configure the Top Hotels report to highlight different aspects of the data:
- The report may be displayed as a horizontal bar chart, vertical bar chart, or stacked bar chart.
- Data may be sorted by affinity, by percentage of selected users, or by percentage of baseline users.
- By default, the report shows the distribution of audiences across the top ten hotels. Use the Count dropdown list to choose the number of hotels displayed.
Top Hotels report data is based on previous 30 days of Top Hotels module data. To learn more, see Top Hotels module data sources.
Top Airlines
The Top Airlines report shows the distribution of profiled selected users and baseline users by airlines booked.
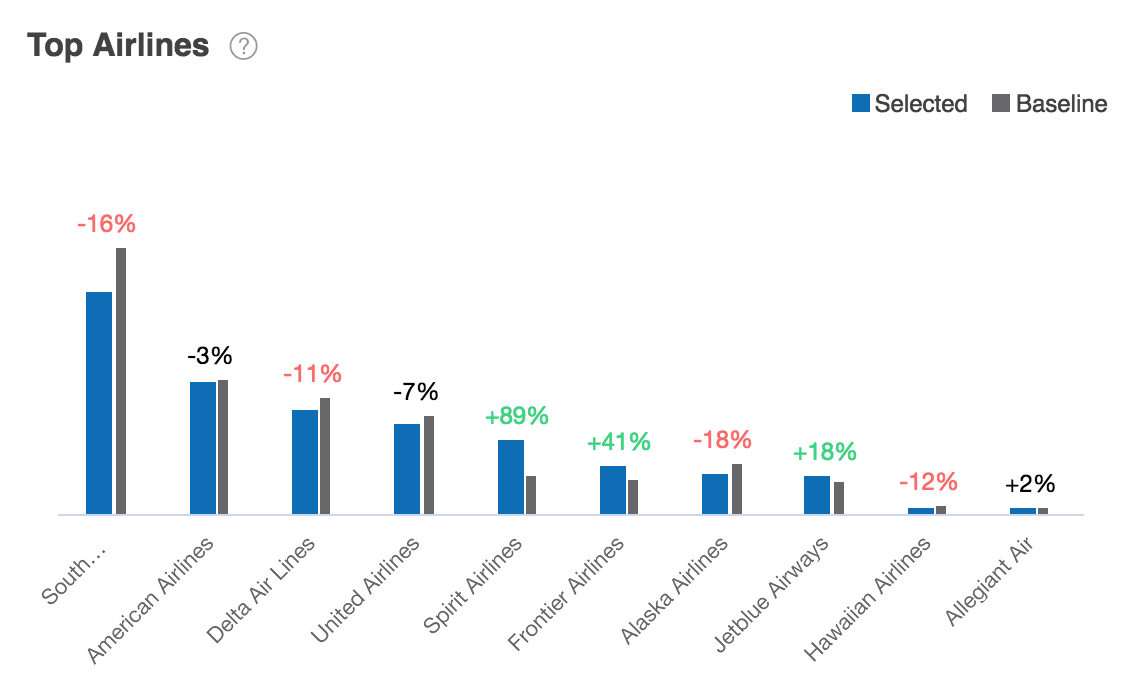
Fig. 79 Top Airlines Report
Using controls in the console, you can configure the Top Airlines report to highlight different aspects of the data:
- The report may be displayed as a horizontal bar chart, vertical bar chart, or stacked bar chart.
- Data may be sorted by affinity, by percentage of selected users, or by percentage of baseline users.
- By default, the report shows the distribution of audiences across the top ten airlines. Use the Count dropdown list to choose the number of airlines displayed.
Top Airlines report data is based on previous 30 days of Top Hotels module data. To learn more, see Top Airlines module data sources.
Top Booking Providers
The Top Booking Providers report shows the distribution of selected users and baseline users by top booking providers.

Fig. 80 Top Booking Providers Report
Using controls in the console, you can configure the Top Booking Providers report to highlight different aspects of the data:
- The report may be displayed as a horizontal bar chart, vertical bar chart, or stacked bar chart.
- Data may be sorted by affinity, by percentage of selected users, or by percentage of baseline users.
- By default, the report shows the distribution of audiences across the top ten booking providers. Use the Count dropdown list to choose the number of booking providers displayed.
Top Airlines report data is based on previous 30 days of Top Hotels module data. To learn more, see Top Booking Providers module data sources.
Top Destinations
The Top Destinations report shows the distribution of profiled selected users and baseline users by travel destinations.
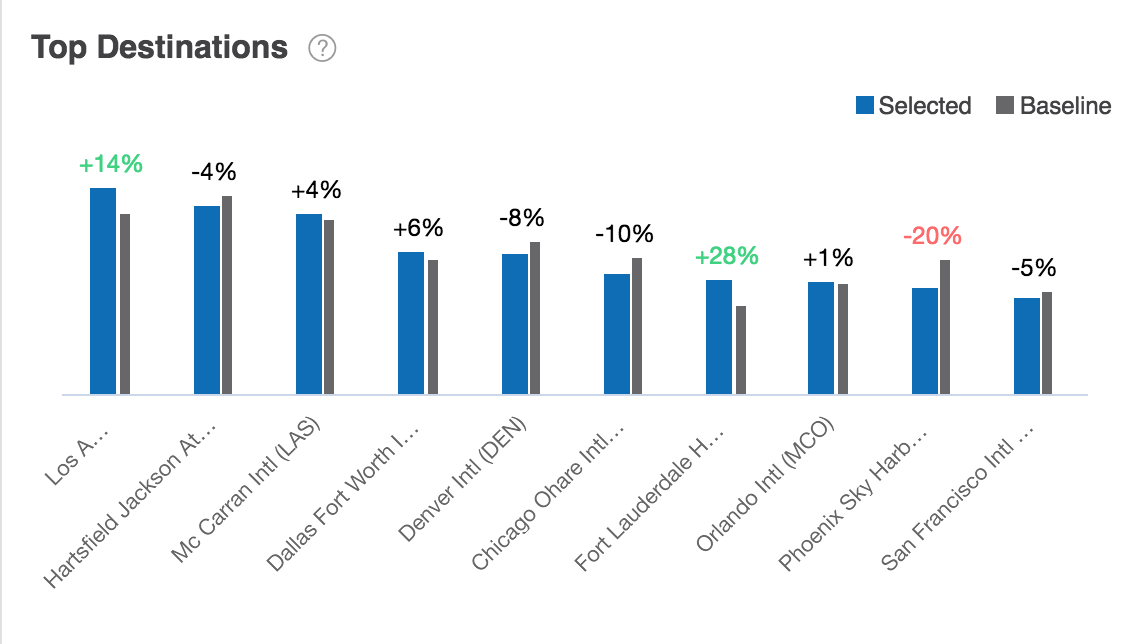
Fig. 81 Top Destinations Report
Using controls in the console, you can configure the Top Destinations report to highlight different aspects of the data:
- The report may be displayed as a horizontal bar chart, vertical bar chart, or stacked bar chart.
- Data may be sorted by affinity, by percentage of selected users, or by percentage of baseline users.
- By default, the report shows the distribution of audiences across the top ten destinations. Use the Count dropdown list to choose the number of destinations displayed.
Top Destinations report data is based on previous 30 days of Top Destination module data. To learn more, see Top Destinations module data sources.
Travel Characteristics (Travel Type)
The Travel Characteristics (Travel Type) report shows the distribution of selected users and baseline users by travel type.
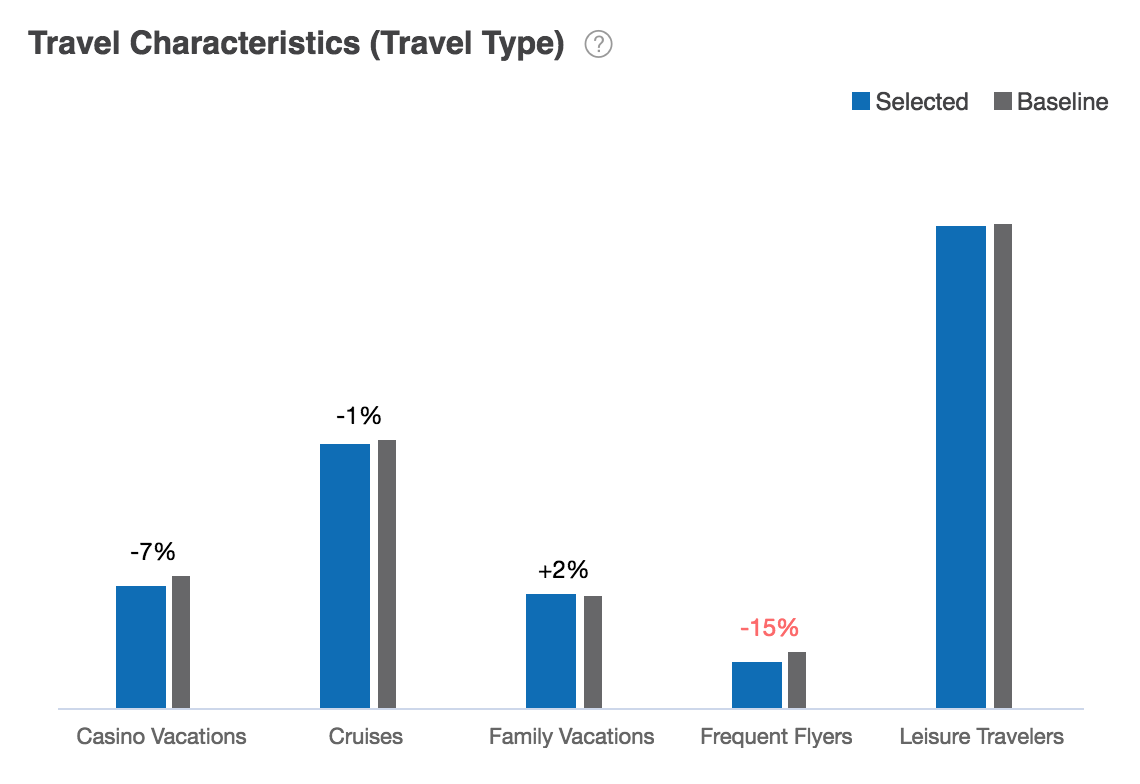
Fig. 82 Travel Characteristics Travel Type Report
The Travel Characteristics (Travel Type) reports may be displayed as a horizontal bar chart, vertical bar chart, or stacked bar chart.
Top Characterstics (Travel Type) report data is based on previous 30 days of Travel Charactertistics module data. To learn more, see Travel Characteristics module data sources.
Travel Characteristics (Traveler Type)
The Travel Characteristics (Traveler Type) report shows the distribution of selected users and baseline users by traveler type.
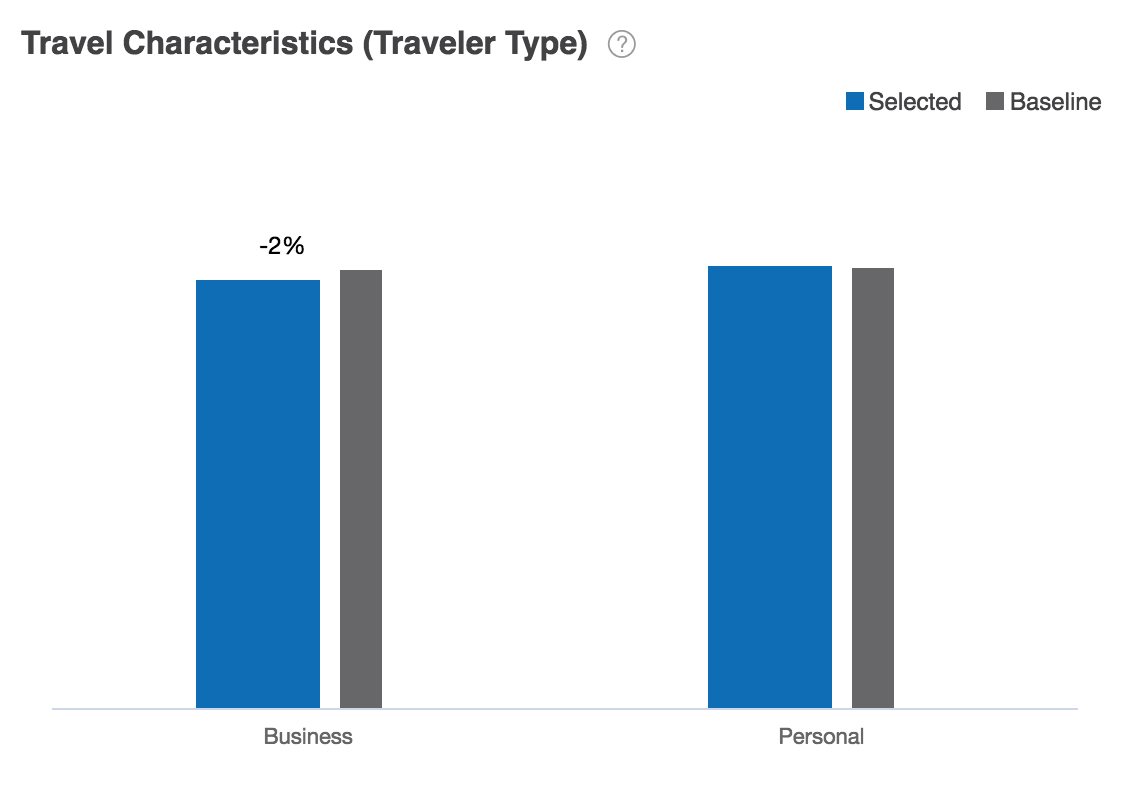
Fig. 83 Travel Characteristics Traveler Type Report
The Travel Characteristics reports may be displayed as a horizontal bar chart, vertical bar chart, or stacked bar chart.
Top Characterstics (Traveler Type) report data is based on previous 30 days of Travel Charactertistics module data. To learn more, see Travel Characteristics module data sources.